![]()
Добрый день! Уважаемые читатели и гости популярного блога, о Vmware ESXI и настройке серверов pyatilistnik.org. Относительно недавно, я вам рассказывал, как создавать свои оповещения в vCenter 5.5 (тригеры). Там я показывал, как редактируются встроенные тригеры. Сегодня на одном из моих датасторов, выскочило предупреждение: Datastore usage on disk, сам LUN имеет размеры 4 ТБ и на нем было свободно более 800 гигабайт. Данное оповещение сообщает, что у меня начинает заканчиваться свободное место на дисковом массиве, но в виду того, что свободно 800 гигабайт, это оповещение мне кажется лишним. Я вам покажу, как его поправить в vCenter 6.5 сервере.
Как выглядит предупреждение Datastore usage on disk
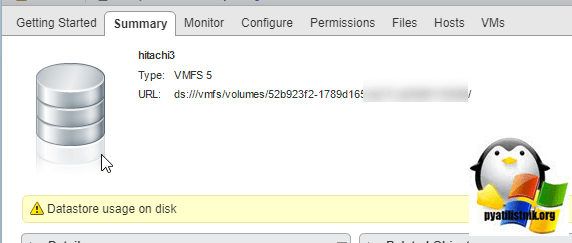
Вот так вот на вкладке «Summary» выглядит предупреждение.
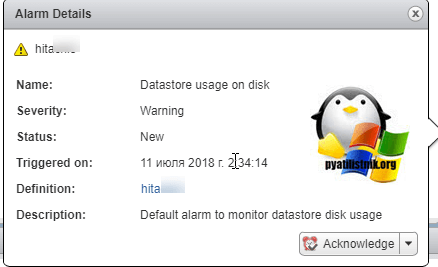
Если вы более подробно посмотрите сообщение, то вы увидите, что это стандартное оповещение (alarm) используемое в мониторинге гипервизоров.
Варианты решения проблемы
Данное уведомление очень полезное, так как системный администратор будет в курсе, что у него заканчивается место, хотя уверен, что он об этом узнает из другой системы мониторинга, например, Zabbix. Но если у вас ситуация как у меня, когда на датасторе полно место и вы не хотите, чтобы предупреждение мозолило вам глаза, то у вас два варианта, точнее три:
- Освободить свободное место на нужном датасторе ESXI хоста, не всегда представляется возможным
- Полностью отключить оповещение, не самый лучший вариант
- Отредактировать настройки, и изменить значения срабатывания тригера, наш выбор
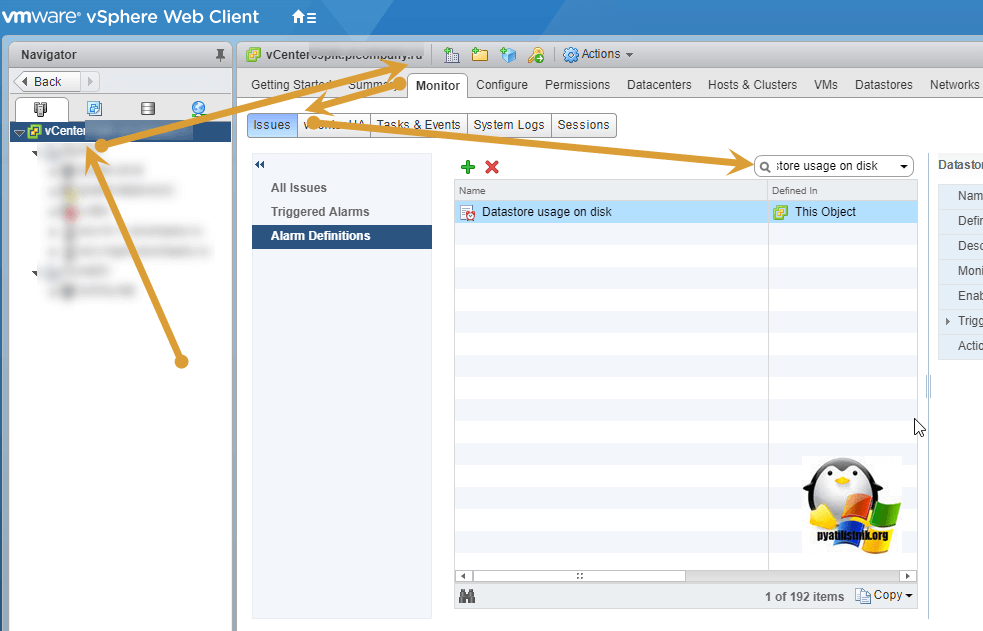
Для того, чтобы изменить параметры, нужного вам задания по мониторингу, выберите в корне ваш vCenter 6.5 сервер, раздел «Monitor«, вкладка Issues, в которой выберите пункт «Alarm Definitions«. В поисковой строке введите «Datastore usage on disk». В итоге у вас будет выполнен фильтр по данному имени.
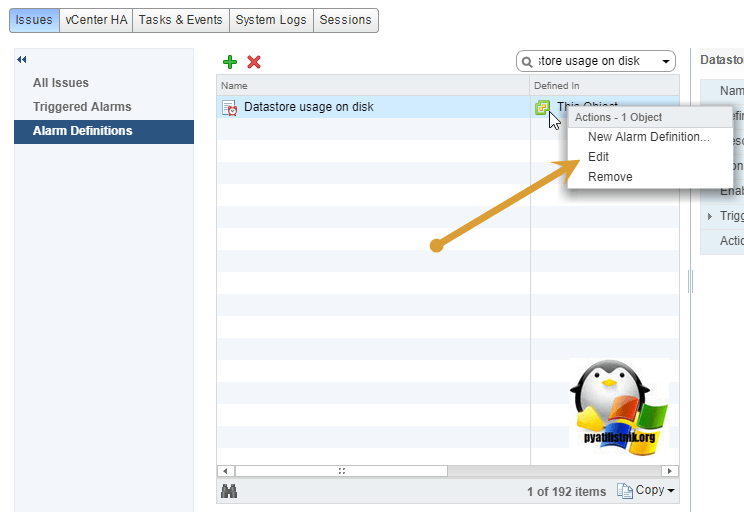
Щелкните по нему правой кнопкой мыши и из контекстного меню выберите пункт «Edit», для его редактирования.
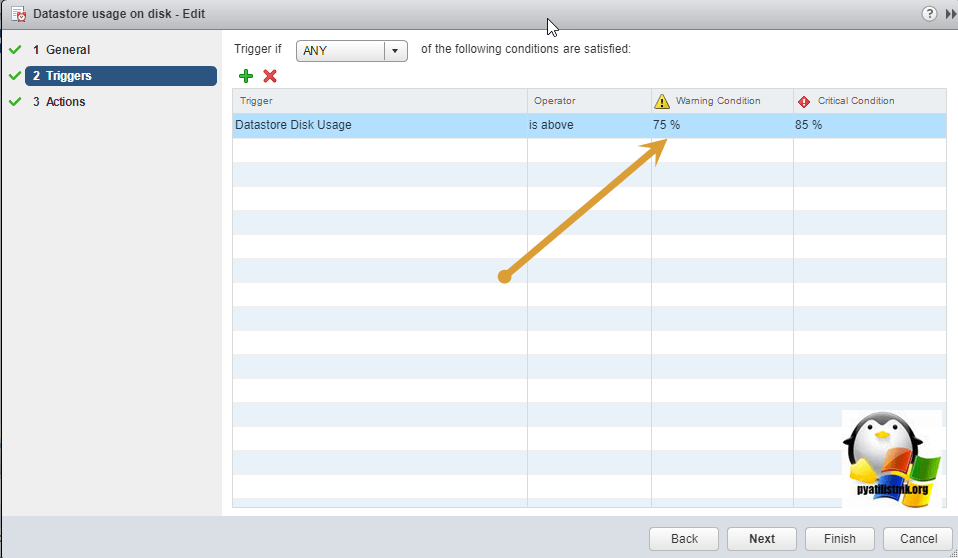
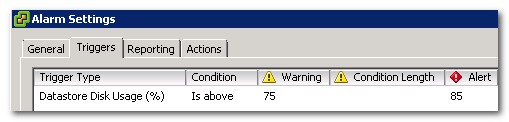
Откройте пункт «Triggers», в нем вы увидите значения при которых он будет срабатывать. По умолчанию, это 75% занятого места, это предупреждение и 85% это критический alarm.
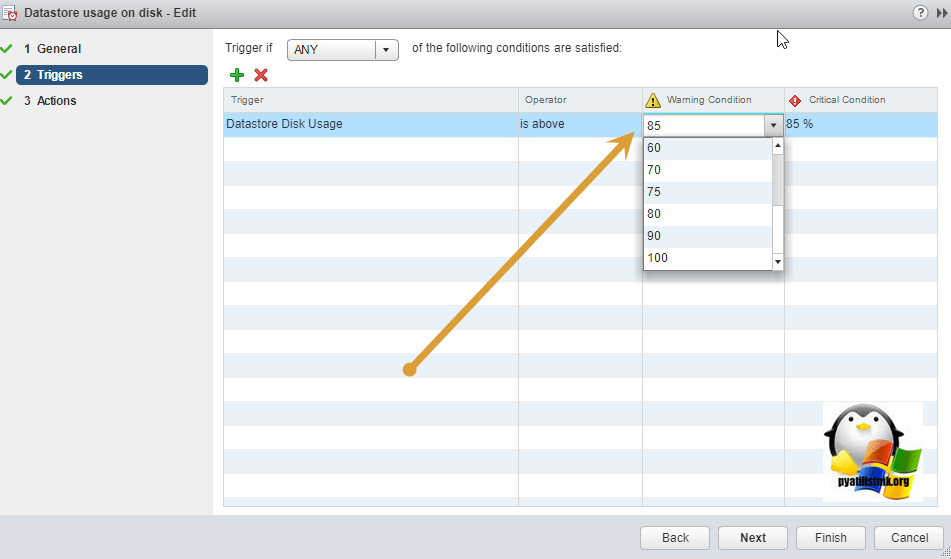
Щелкните по ним и измените значения на свои.
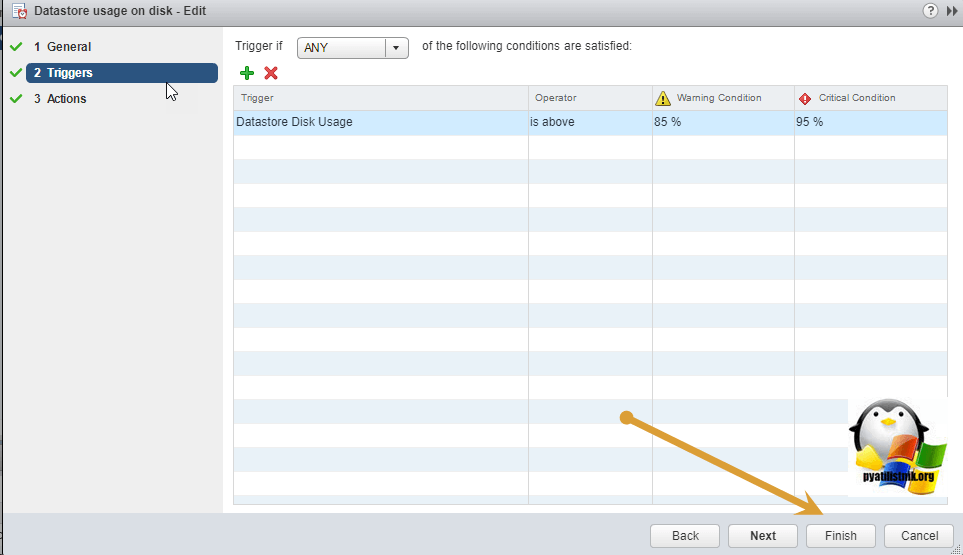
Я выставил 85% для предупреждения и 95% для критического сигнала. Сохраняем изменения, и ручками очищаем текущие уведомления, через функцию «reset to Green».
Второй метод, полного отключения политики оповещения по тригеру «Datastore usage on disk». Делается это, через VMware PowerCLI. Подключитесь, через команду Connect-viserver -Server имя сервера, если будет ошибка проверки сертификата (Invalid server certificate), то ее решение в скобках.
Запросим текущее состояние политики с помощью команды:
Get-AlarmDefinition -Name ‘Datastore usage on disk’
Как видите она включена и имеет значение «True». Давайте ее отключим, для этого есть две команды, которые я подсмотрел на (https://kb.vmware.com/s/article/2076157):
Get-AlarmDefinition -Name ‘Datastore usage on disk’ | Set-AlarmDefinition -Enabled:$false
для включения политики, выполните:
Get-AlarmDefinition -Name ‘Datastore usage on disk’ | Set-AlarmDefinition -Enabled:$true
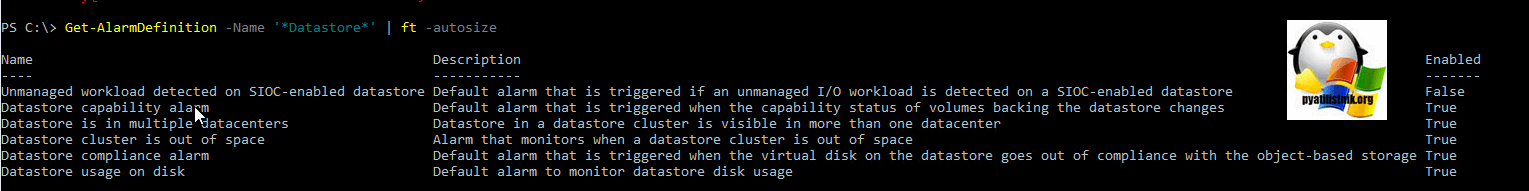
Посмотреть все политики оповещения связанные с датастором, можно вот так:
Get-AlarmDefinition -Name ‘*Datastore*’ | ft -autosize
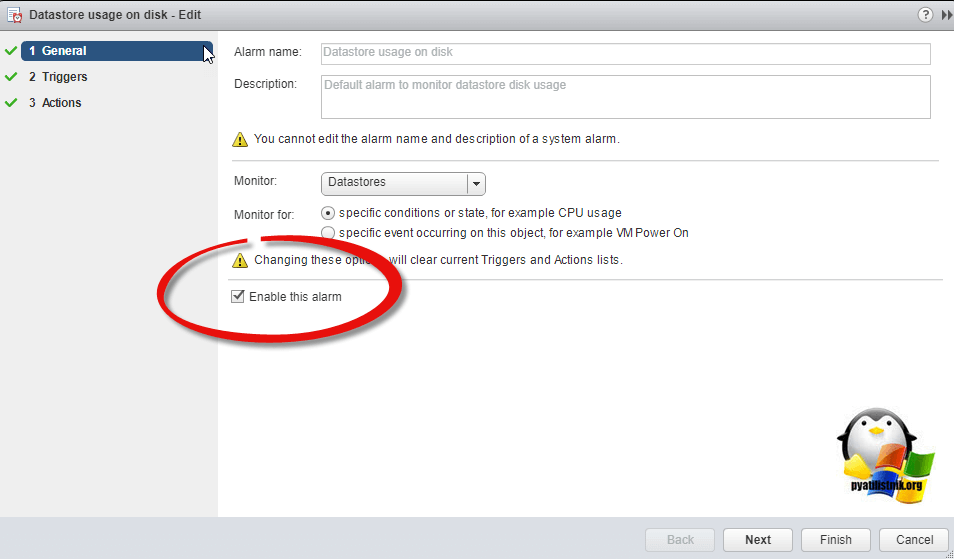
Из графического интерфейса можно выключить тригер, сняв галку «Enable this alarm»
Старайтесь не доводить ваши датасторы, до уведомления «Datastore usage on disk»
- Mark as New
- Bookmark
- Subscribe
- Mute
- Subscribe to RSS Feed
- Permalink
- Report Inappropriate Content
So you want to reduce the vmdk size of the guest os? If that’s what your looking to do you could utilize VMware converter to redo the disk layout and lower the disk size. You could also utilize sdelete and storage vmotion to move it to another datastore as a thin provisoned disk. I’ve never done the latter but seen it mentioned several times here in the forums.
If you found this or any other post helpful please consider the use of the Helpful/Correct buttons to award points
Twitter: http://twitter.com/mittim12
- Mark as New
- Bookmark
- Subscribe
- Mute
- Subscribe to RSS Feed
- Permalink
- Report Inappropriate Content
I would check to make sure that you don’t have any VMs that are currently running on snapshots. This discrepancy could be caused by this.
If you found this at all helpful please award points by using the correct or helpful buttons! Thanks!
James B. | Blog: http://www.vSential.com | Twitter: @vSential
—
If you found this helpful then please awards helpful or correct points accordingly. Thanks!
- Mark as New
- Bookmark
- Subscribe
- Mute
- Subscribe to RSS Feed
- Permalink
- Report Inappropriate Content
- Mark as New
- Bookmark
- Subscribe
- Mute
- Subscribe to RSS Feed
- Permalink
- Report Inappropriate Content
Ok, so just want to clarify and you let me know if this is right.
We have a thin provisioned vmdk of around 85 GB on a 86 GB data store. The vmdk has grown to around 65 GB or so and the datastore is around 20GB of free space. You look inside the VM and notice that 78 GB or so is free and your wondering why the datastore is out of space and how to fix it?
If you found this or any other post helpful please consider the use of the Helpful/Correct buttons to award points
Twitter: http://twitter.com/mittim12
- Mark as New
- Bookmark
- Subscribe
- Mute
- Subscribe to RSS Feed
- Permalink
- Report Inappropriate Content
hi mittim12.
very close. i know why it grew, a LOG file got very large (@ the OS level) forcing the datastore to grow as well (@ the VM level).
i am 90% sure that was thr root cause.
but i would like to know how to fix it, or i should ignore it.
- Mark as New
- Bookmark
- Subscribe
- Mute
- Subscribe to RSS Feed
- Permalink
- Report Inappropriate Content
If you want to reclaim the space your options are to use VMware converter or to use sdelete inside the VM to zero out the free space and storage vMotion that vmdk to another datastore while specifiying thin disk.
If you found this or any other post helpful please consider the use of the Helpful/Correct buttons to award points
Twitter: http://twitter.com/mittim12
- Mark as New
- Bookmark
- Subscribe
- Mute
- Subscribe to RSS Feed
- Permalink
- Report Inappropriate Content
do you recommend sDelete with both -c and -z or ONLY -z?
thank you.
Usage: sdelete
sdelete -z
-c Zero free space (good for virtual disk optimization).
-p passes Specifies number of overwrite passes.
-s Recurse subdirectories.
-q Don’t print errors (quiet).
-z Cleanse free space.
I don’t have much experience using VMware or managing datastores. We have a concern about our datastores that I believe should be addressed, and hopefully fixed without too much repercussion.
Basically we have 4 datastores that are throwing alarms «Datastore usage on disk». The VM’s on these datastores are provisioned either thick lazy zeroed or thin provisioning.
I am attaching a screenshot of the VMs and Templates list and the triggered alarms these VM’s/Datastores are throwing.
I’d also like to better understand provisioning and best practices for my VM’s going forward. I’ve read the basic description of the different types, but I guess I need a more layman’s explanation of how it works.
attach_file
Attachment
vmware_datastore_errors.JPG
124 KB
Background
I was doing an upgrade from 4.0 to 4.1 this week on a two node cluster. This cluster is owned by an SMB and its a fully contained VMware setup, basically it has two DL380 G6 servers each with 8 – 146GB 10k SAS drives, dual Nehalem processors, and 24GB of ram. We have HP’s P4000 VSA software installed on each node to form a redundant two node SAN, so each server has all 8 drives in a RAID5 and a single VMware VMFS volume on them. Inside of that volume we have a single virtual machine (the VSA) and it consumes about 90% of the space in that datastore. Inside of the VSA is where all of the production VM’s live, but the problem is that the local datastores are in an alarm state because they are above the threshold set at the vcenter level. I suppose I could just change that threshold to like 98% or something and the alarms would go away, but that wouldn’t let us much time to react if the VSA volume ever got full. So the better solution would be to somehow ignore alarms on local datastores but still keep the alarms for shared datastores. Below is what the problem looks like… Local datastores are in an alarm state… but the “real” data which is in “VM Storage Repository” is not full yet.

Solution
After doing a little research I was able to come by one other blog post that used this same method on ESX to fix the errors on the service console volume, but I could not find anything related to local and VSA shared volumes. The process is the same for both though, so I figured I would share.
The first step is to log into vcenter (or esxi, whichever your using) and goto the Datastore Inventory tab. Next create two folders, one for local datastores and another for shared. Then drag your local datastores to the local folder and your shared datastores to the shared folder.

Note that the pictures shows how it will look after we delete some alarms and recreate them.
After putting your datastores in the proper folders click on the vcenter, or esxi object (whichever is the top level) and go to the alarms tab (you will need to click on the Definitions button as well. Find the ‘Datastore usage on disk’ alarm and go into it and take some screen shots of how it is setup, we will use these later to recreate the alrm, then delete it. (Or at least disable it) Then go down to the shared datastore folder that you created, and then into the alarms tab again (then click Definitions). In here we will want to recreate a ‘Datastore Usage on Disk’ alarm so that we still get alarms for our shared storage. Right click and Add new. and then refer to the screenshots you took in order to create it properly. Just for reference here is what it looks like inside of the alarm definition:

Now you should have something that looks like the last screen shot… you will have a ‘Datastore Usage on Disk’ alarm that has been created in “This object” and your local datastores are no longer monitored. If you wanted to you could create a disk usage alarm for the local folder and set its thresholds much higher just to be safe.
![]()

Justin is a blogger at https://jpaul.me who works for Zerto, a cloud data management and protection software provider. He is married and a father of three children. He is also a farmer in his «spare time». Justin also enjoys gardening and unwinding at the end of the day with a good bourbon whiskey.
![]()
Добрый день! Уважаемые читатели и гости популярного блога, о Vmware ESXI и настройке серверов pyatilistnik.org. Относительно недавно, я вам рассказывал, как создавать свои оповещения в vCenter 5.5 (тригеры). Там я показывал, как редактируются встроенные тригеры. Сегодня на одном из моих датасторов, выскочило предупреждение: Datastore usage on disk, сам LUN имеет размеры 4 ТБ и на нем было свободно более 800 гигабайт. Данное оповещение сообщает, что у меня начинает заканчиваться свободное место на дисковом массиве, но в виду того, что свободно 800 гигабайт, это оповещение мне кажется лишним. Я вам покажу, как его поправить в vCenter 6.5 сервере.
Вот так вот на вкладке «Summary» выглядит предупреждение.

Если вы более подробно посмотрите сообщение, то вы увидите, что это стандартное оповещение (alarm) используемое в мониторинге гипервизоров.

Варианты решения проблемы
Данное уведомление очень полезное, так как системный администратор будет в курсе, что у него заканчивается место, хотя уверен, что он об этом узнает из другой системы мониторинга, например, Zabbix. Но если у вас ситуация как у меня, когда на датасторе полно место и вы не хотите, чтобы предупреждение мозолило вам глаза, то у вас два варианта, точнее три:
- Освободить свободное место на нужном датасторе ESXI хоста, не всегда представляется возможным
- Полностью отключить оповещение, не самый лучший вариант
- Отредактировать настройки, и изменить значения срабатывания тригера, наш выбор
Для того, чтобы изменить параметры, нужного вам задания по мониторингу, выберите в корне ваш vCenter 6.5 сервер, раздел «Monitor«, вкладка Issues, в которой выберите пункт «Alarm Definitions«. В поисковой строке введите «Datastore usage on disk». В итоге у вас будет выполнен фильтр по данному имени.

Щелкните по нему правой кнопкой мыши и из контекстного меню выберите пункт «Edit», для его редактирования.

Откройте пункт «Triggers», в нем вы увидите значения при которых он будет срабатывать. По умолчанию, это 75% занятого места, это предупреждение и 85% это критический alarm.

Щелкните по ним и измените значения на свои.

Я выставил 85% для предупреждения и 95% для критического сигнала. Сохраняем изменения, и ручками очищаем текущие уведомления, через функцию «reset to Green».

Второй метод, полного отключения политики оповещения по тригеру «Datastore usage on disk». Делается это, через VMware PowerCLI. Подключитесь, через команду Connect-viserver -Server имя сервера, если будет ошибка проверки сертификата (Invalid server certificate), то ее решение в скобках.
Запросим текущее состояние политики с помощью команды:
Get-AlarmDefinition -Name ‘Datastore usage on disk’
Как видите она включена и имеет значение «True». Давайте ее отключим, для этого есть две команды, которые я подсмотрел на (https://kb.vmware.com/s/article/2076157):

Get-AlarmDefinition -Name ‘Datastore usage on disk’ | Set-AlarmDefinition -Enabled:$false
для включения политики, выполните:
Get-AlarmDefinition -Name ‘Datastore usage on disk’ | Set-AlarmDefinition -Enabled:$true
Посмотреть все политики оповещения связанные с датастором, можно вот так:
Get-AlarmDefinition -Name ‘*Datastore*’ | ft -autosize
Из графического интерфейса можно выключить тригер, сняв галку «Enable this alarm»

Старайтесь не доводить ваши датасторы, до уведомления «Datastore usage on disk»
Background
I was doing an upgrade from 4.0 to 4.1 this week on a two node cluster. This cluster is owned by an SMB and its a fully contained VMware setup, basically it has two DL380 G6 servers each with 8 – 146GB 10k SAS drives, dual Nehalem processors, and 24GB of ram. We have HP’s P4000 VSA software installed on each node to form a redundant two node SAN, so each server has all 8 drives in a RAID5 and a single VMware VMFS volume on them. Inside of that volume we have a single virtual machine (the VSA) and it consumes about 90% of the space in that datastore. Inside of the VSA is where all of the production VM’s live, but the problem is that the local datastores are in an alarm state because they are above the threshold set at the vcenter level. I suppose I could just change that threshold to like 98% or something and the alarms would go away, but that wouldn’t let us much time to react if the VSA volume ever got full. So the better solution would be to somehow ignore alarms on local datastores but still keep the alarms for shared datastores. Below is what the problem looks like… Local datastores are in an alarm state… but the “real” data which is in “VM Storage Repository” is not full yet.
Solution
After doing a little research I was able to come by one other blog post that used this same method on ESX to fix the errors on the service console volume, but I could not find anything related to local and VSA shared volumes. The process is the same for both though, so I figured I would share.
The first step is to log into vcenter (or esxi, whichever your using) and goto the Datastore Inventory tab. Next create two folders, one for local datastores and another for shared. Then drag your local datastores to the local folder and your shared datastores to the shared folder.
Note that the pictures shows how it will look after we delete some alarms and recreate them.
After putting your datastores in the proper folders click on the vcenter, or esxi object (whichever is the top level) and go to the alarms tab (you will need to click on the Definitions button as well. Find the ‘Datastore usage on disk’ alarm and go into it and take some screen shots of how it is setup, we will use these later to recreate the alrm, then delete it. (Or at least disable it) Then go down to the shared datastore folder that you created, and then into the alarms tab again (then click Definitions). In here we will want to recreate a ‘Datastore Usage on Disk’ alarm so that we still get alarms for our shared storage. Right click and Add new. and then refer to the screenshots you took in order to create it properly. Just for reference here is what it looks like inside of the alarm definition:
Now you should have something that looks like the last screen shot… you will have a ‘Datastore Usage on Disk’ alarm that has been created in “This object” and your local datastores are no longer monitored. If you wanted to you could create a disk usage alarm for the local folder and set its thresholds much higher just to be safe.

When I’m not spending time with my family I can usually be found helping my dad farm, working on old cars, blogging, or enjoying a craft beer with the guys.
-
kayvonp@re-wa.org
- Influencer
- Posts: 14
- Liked: 1 time
- Joined: Aug 13, 2018 1:52 pm
- Full Name: KTHP
- Contact:
‘Datastore usage on disk’ Alarm in VMware for Veeam Proxy
I am getting a strange error for one of my Veeam proxies. I don’t completely understand it.
In VMware, I have two datastores that were created by Veeam — one for my Veeam server and one for a backup proxy. I have a second backup proxy that does not have a datastore, though to my knowledge the two proxies are identical. I don’t understand what these datastores do — can anyone explain?
The error I get is for used space on the datastore for the proxy. It has reached >75% used. The one for my Veeam server, however, is only using about .5% of its space.
I tried searching online for the error, but all I found was errors about space filling up on the actual backup drives. These datastores aren’t where backups are stored, but rather datastores created by Veeam in VMware.
-
PTide
- Product Manager
- Posts: 6249
- Liked: 687 times
- Joined: May 19, 2015 1:46 pm
- Contact:
Re: ‘Datastore usage on disk’ Alarm in VMware for Veeam Proxy
Post
by PTide » Nov 16, 2018 5:03 pm
Hi,
I can’t see it very clear from my side of the screen, but I think that those must be NFS datastores that are in fact vPower NFS shares. Does it look any similar to this picture? If yes, then I would check if there are any rouge Instant Restore or SureBackup VMs running in your environment.
Thanks!
-
kayvonp@re-wa.org
- Influencer
- Posts: 14
- Liked: 1 time
- Joined: Aug 13, 2018 1:52 pm
- Full Name: KTHP
- Contact:
-
PTide
- Product Manager
- Posts: 6249
- Liked: 687 times
- Joined: May 19, 2015 1:46 pm
- Contact:
Re: ‘Datastore usage on disk’ Alarm in VMware for Veeam Proxy
Post
by PTide » Nov 16, 2018 6:01 pm
Have you checked what occupies the space on the datastores? If there is nothing on the actual datastore, then I would suggest to check it from the NFS server side, maybe something is taking up storage space on the disk where your NFS folder resides.
Thanks!
-
kayvonp@re-wa.org
- Influencer
- Posts: 14
- Liked: 1 time
- Joined: Aug 13, 2018 1:52 pm
- Full Name: KTHP
- Contact:
Re: ‘Datastore usage on disk’ Alarm in VMware for Veeam Proxy
Post
by kayvonp@re-wa.org » Nov 16, 2018 6:04 pm
I browsed it in VSphere and it appears empty.
«I would suggest to check it from the NFS server side, maybe something is taking up storage space on the disk where your NFS folder resides.»
How do I go about this? I scanned the disk on the proxy server itself and didn’t find anything. Is it located elsewhere?
-
PTide
- Product Manager
- Posts: 6249
- Liked: 687 times
- Joined: May 19, 2015 1:46 pm
- Contact:
Re: ‘Datastore usage on disk’ Alarm in VMware for Veeam Proxy
Post
by PTide » Nov 16, 2018 6:09 pm
You should check disks on the servers that have been assigned «Mount server» roles. When you setup a repository you are offered to choose where your mount server should reside, and where write cache location should be (default value is C:ProgramDataVeeamBackupNfsDatastore). You need to review your settings and check how much space those location have.
Thanks!
-
kayvonp@re-wa.org
- Influencer
- Posts: 14
- Liked: 1 time
- Joined: Aug 13, 2018 1:52 pm
- Full Name: KTHP
- Contact:
Re: ‘Datastore usage on disk’ Alarm in VMware for Veeam Proxy
Post
by kayvonp@re-wa.org » Nov 16, 2018 6:24 pm
That’s kinda what I thought it was, but this particular server isn’t used as a mount server for anything. It’s only used as a proxy. The server that does act as a mount server is clear.
I do have a C:ProgramDataVeeamBackupNfsDatastore folder on that server, but it is empty.
-
PTide
- Product Manager
- Posts: 6249
- Liked: 687 times
- Joined: May 19, 2015 1:46 pm
- Contact:
Re: ‘Datastore usage on disk’ Alarm in VMware for Veeam Proxy
Post
by PTide » Nov 16, 2018 6:31 pm
Then, if the disk where the NfsDatatores directories reside at are not in shortage of space, please contact our support team directly so they can dig into the problem, because the described behaviour does not look expected. Once you do please post your case ID here for future reference.
Thanks!
Who is online
Users browsing this forum: Bing [Bot] and 16 guests
If there’s one thing that’s apparent when supporting vSphere environments, its that it’s never good news when a datastore has ran out of space. This article will look at how you can configure datastore alarms. Datastores can run out of space due to a number of reasons, the most common ones being snapshots and thin provisioning. The use of thin provisioning increases the possibility of oversubscribing storage at the datastore level.
There are a number of potential issues that can occur when a datastore is low on or out of space. These include virtual machine startup failure, vmotion failures, snapshot creation and commit failures and overall poor performance. This is where datastore alarms are extremely useful:

Datastore usage on disk alarms can be used to monitor the percentage of disk space usewd on each datastore in your vSphere environment. The default settings of the Datastore usage on disk alarm is to trigger a Warning when disk usage exceeds 75% and an Alert at 85%. These thresholds can be adjusted to suit the needs of your environment, although it is good practice to begin taking action as your arrays approach 80% utilized. This may vary depending on the size of your datastores and how they are being used.
We can see how the triggers are configured by viewing the alarm’s settings:
Along with the built in datastore alarms, custom alarms can be configured for datastores and datastore clusters.
Creating a Custom Datastore Alarm
The steps for creating a custom datastore alarms using the vSphere client are as follows:
- Go to the Datastores and Datastore Clusters view.
- Right-click the datastore to be monitored then click Alarm > Add Alarm. This will bring up the alarm’s settings screen.
- On the General tab enter a name for the alarm. For the Alarm Type, ensure that Datastore is selected and that Monitor for specific conditions or state and Enable this alarm are selected.
- On the Triggers tab, choose to trigger an alert if any or all of the conditions are met. Click Add. The Datastore Disk Usage Trigger will populate. Enter the desired settings for both Warnings and Alerts.
- On the Reporting tab, enter the desired settings for the Range and Frequency of the triggered alarm.
- On the Actions tab, choose to Send a notification email, Send a notification trap and/or Run a command. Once configuration is complete, click ok to save the custom alarm.
Working with and Analysing Datastore Alarms
The datastore usage alarm will send notifications when a datastore has exceeded it’s configured thresholds. To test this you can create a custom datastore usage alarm and set the thresholds to be along the lines of Warning when Datastore Disk Usage exceeds 10% and an Alert at 15%. On the datastore where I configured the alarm these thresholds were enough to generate a notification.
Where can you see these alerts?
Within the vSphere client you can see the alerts in a couple of places. The first is the vCenter Events screen, access from the Home screen:

The other is in the Datastores and Datastore Clusters view. We should see a red exclaimation mark over any datastore that has triggered an alert. Selecting the datastore and then the alarms tab will give detail about which alarm has triggered the alert or warning:

When you right click on a triggered alarm you get the option to clear the alarm or acknowledge it. If it is cleared then the alert will disappear, but will alert again depending on what its set in the alarm settings. For example, the default datastore usage alarm will trigger again if the thresholds are still exceeded after 5 minutes. Acknowledging the alarm won’t make it disappear, but it will become greyed out. This feature is to show that the alarm/fault is being worked on by an administrator. Clearing or acknowledging an alarm is treated as an event and is recorded in the vCenter events screen.
What can you do if a datastore is running out of space?
The most common remediation steps include:
- Increasing capacity by adding extents or extending the size of the LUN and VMFS volume.
- Use svMotion to move virtual machines to free up space
- Add additional datastores to migrate virtual machines to
- Delete unneeded snapshots on virtual machines on the datastore in question.
PowerCLI and Datastore Alarms
You can also list and interact with datastore alarms using PowerCLI. For example, to list the alarms in use for a particular datastore you can run:
get-datastore datastorename | get-alarmdefinition | select name,description | ft -auto

References and Useful Links
https://pubs.vmware.com/vsphere-51/index.jsp?topic=%2Fcom.vmware.vsphere.solutions.doc%2FGUID-067B62CC-5EB7-42C0-BA30-A3FF0F4916AB.htmlhttps://blogs.vmware.com/vipowershell/2010/12/managing-vsphere-alarms-with-powercli.htmlhttps://kb.vmware.com/selfservice/microsites/search.do?language=en_US&cmd=displayKC&externalId=1003412
One of the complaints of vCenter 2.x was the limited number of alarms that could be configured. With vCenter 4.x VMware addressed this by giving admins the ability to create alarms for just about any event on any object.
There are several alarms that are configured out of box and defined at the topmost vCenter server level.

One of the pre-configured alarms that seems to always be in a warnings state is the “Datastore usage on disk” alarm. 95% of the time this alarm is in a warning state because of the local VMFS data store that is required in ESX 4 for the Service Console OS to live in.
![]()
I still have yet to understand why VMware decided to put the COS in a VMDK. If anyone knows why this is beneficial I would love to here from you.
Anyway, back to the “Datastore usage on disk” alarm issue.
I have found that the following procedure is the best way to prevent this alarm on the local VMFS datastores.
- Go to the Home –>Inventory—>Datastores view in the vSphere Client
- Right-click on your datacenter and create two new folders, one named LOCAL-COS-DATASTORES and one named SAN-DATASTORES.
- Drag and drop the local VMFS datastores into the LOCAL-COS-DATASTORES folder and the SAN datastores into the SAN-DATASTORES folder.
- Go to the alarm definition for “Datastore usage on disk” and disable it by clearing the Enable this alarm box.

- Create a new alarm at the LOCAL-COS-DATASTORES level named “Datastore usage on LOCAL Disks”.
- Configure the “Datastore usage on LOCAL Disks” trigger to alarm a warning at 90% and alert at 95%.

- Create a new alarm at the SAN-DATASTORES level named “Datastore usage on SAN Disks”.
- Configure the “Datastore usage on SAN Disks” trigger to alarm a warning at 70% and alert at 85%.

Now you should have a lot fewer datastore warning alarms.