Introduction
The dmesg command is a Linux utility that displays kernel-related messages retrieved from the kernel ring buffer. The ring buffer stores information about hardware, device driver initialization, and messages from kernel modules that take place during system startup.
The dmesg command is invaluable when troubleshooting hardware-related errors, warnings, and for diagnosing device failure.
In this tutorial, you will learn how to use the dmesg command in Linux.

Prerequisites
- A computer system running Linux.
- A user account with administrator privileges.
The basic dmesg command syntax is:
dmesg [options]The table below lists the most commonly used dmesg options:
| Option | Description |
|---|---|
-C, --clear |
Clears the ring buffer. |
-c, --read-clear |
Prints the ring buffer contents and then clears. |
-f, --facility [list] |
Restricts output to the specified comma-separated facility [list]. |
-H, --human |
Enables a human-readable output. |
-L, --color[=auto|never|always] |
Adds color to the output. Omitting the [auto|never|always] arguments defaults to auto. |
-l, --level [list] |
Restricts the output to the specified comma-separated level list. |
--noescape |
Disables the feature of automatically escaping unprintable and potentially unsafe characters. |
-S, --syslog |
Instructs dmesg to use the syslog kernel interface to read kernel messages. The default is to use /dev/kmsg instead of syslog. |
-s, --buffer-size [size] |
Uses the specified buffer size to query the kernel ring buffer. The default value is 16392. |
-T, --ctime |
Prints human-readable timestamps. |
-t, --notime |
Instructs dmesg not to print kernel’s timestamps. |
--time-format [format] |
Prints timestamps using the specified [format]. The accepted formats are ctime, reltime, delta, and iso (a dmesg implementation of the ISO-8601 format). |
-w, --follow |
Keeps dmesg running and waiting for new messages. The feature is available only on systems with a readable /dev/kmsg file. |
-x, --decode |
Decodes the facility and level numbers to human-readable prefixes. |
-h, --help |
Displays the help file with all the available options. |
Linux dmesg Command Examples
The examples are common dmesg command use cases.
Display All Messages from Kernel Ring Buffer
Invoking dmesg without any options outputs the entire kernel buffer, without stops, and with no way to navigate the output.
sudo dmesg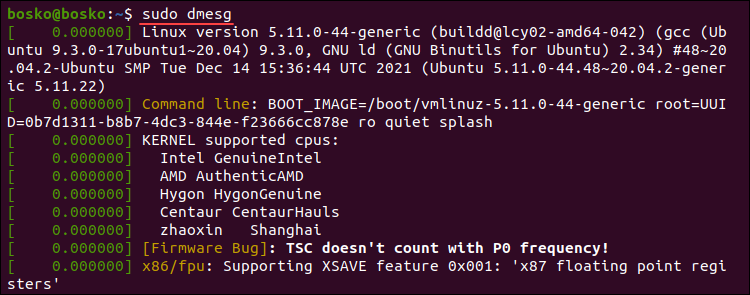
The example above is a partial dmesg command output. For easier navigation and better readability, pipe the dmesg output into a terminal pager such as less, more, or use grep.
For example:
sudo dmesg | less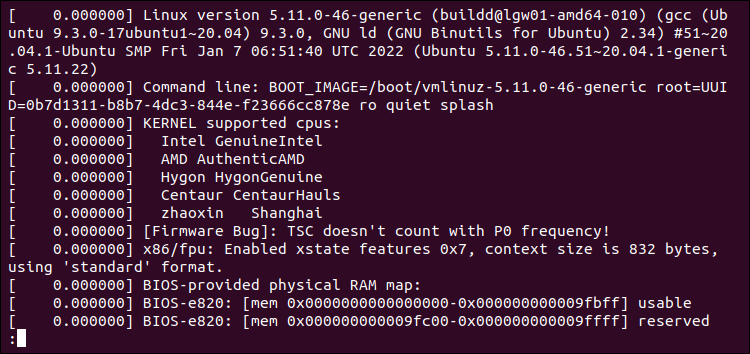
Piping dmesg into less allows you to use the search function to locate and highlight items. Activate search by pressing /. Navigate to the next screen using the Space bar, or reverse using the B key. Exit the output by pressing Q.
Display Colored Messages
By default, dmesg produces a colored output. If the output isn’t colored, use the -L option to colorize it.
sudo dmesg -L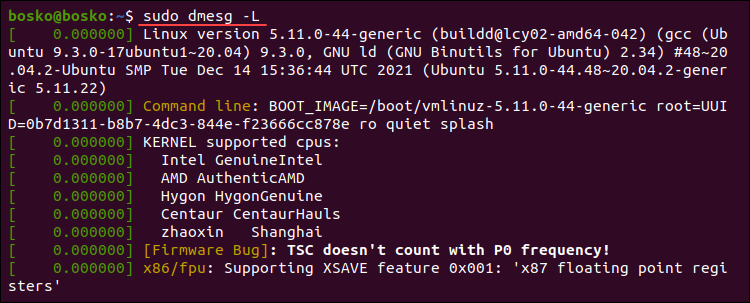
To turn off colored outputs, append the --color=never option to dmesg. Run the following command:
sudo dmesg --color=never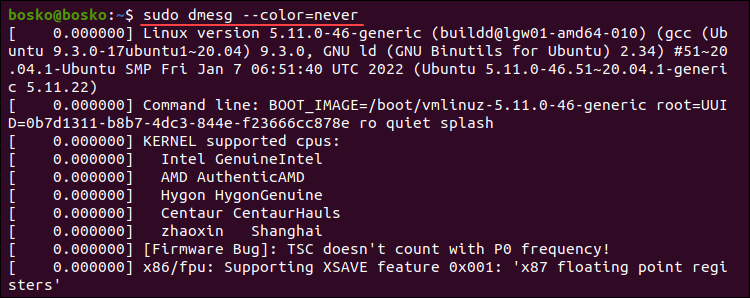
The default dmesg output is now uniform in color.
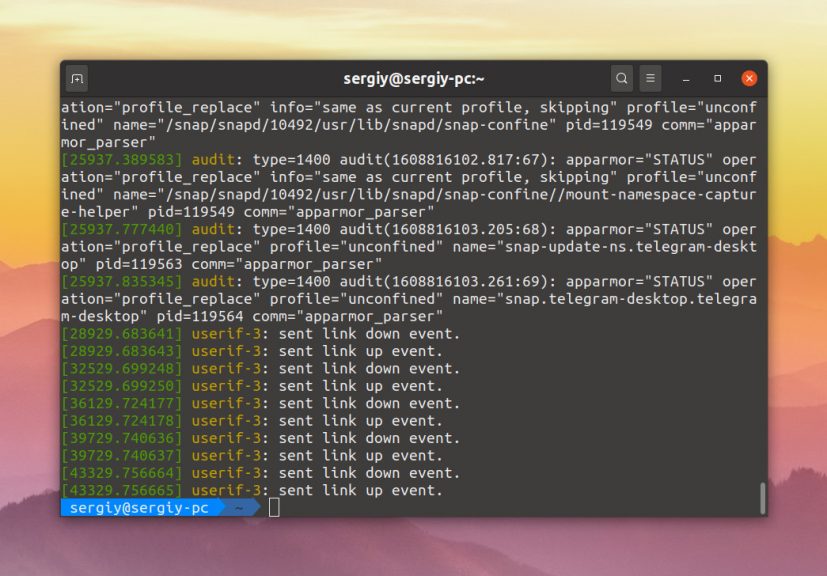
Display Messages as They Arrive
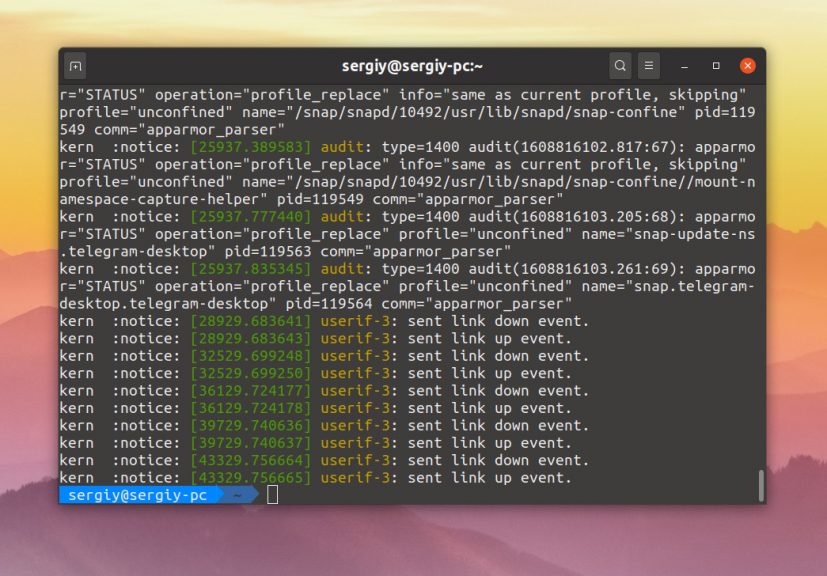
Monitor the kernel ring buffer in real-time using the --follow option. The option instructs the command to wait for new messages related to hardware or kernel modules after system startup.
Run the following dmesg command to enable real-time kernel ring buffer monitoring:
sudo dmesg --followThe command displays any new messages at the bottom of the terminal window. Stop the process using Ctrl+C.
Search for a Specific Term
When searching for specific issues or hardware messages, pipe the dmesg output into grep to search for a particular string or pattern.
For example, if you are looking for messages about memory, run the following command:
dmesg | grep -i memory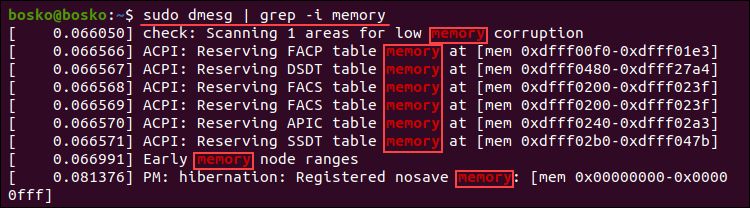
The output shows all the lines from the buffer containing the memory string. The -i (ignore case) switch ignores care sensitivity.
Alternatively, if you are looking for buffer messages about USB, serial ports, network, or hard drives, run the following commands:
USB
dmesg | grep -i usbSerial Ports
dmesg | grep -i ttyNetwork
dmesg | grep -i ethHard Drives
sudo dmesg | grep -i sdaSearch for multiple terms at once by appending the -E option to grep and providing the search terms encased in quotations, separated by pipe delimiters. For example:
sudo dmesg | grep -E "memory|tty"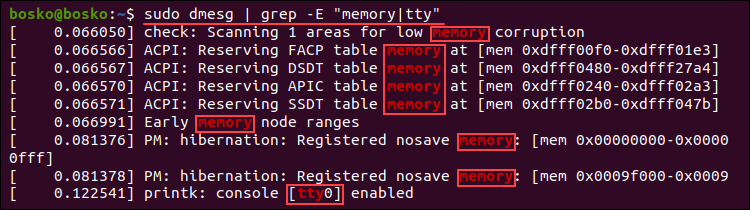
The output prints all the messages containing any of the search terms.
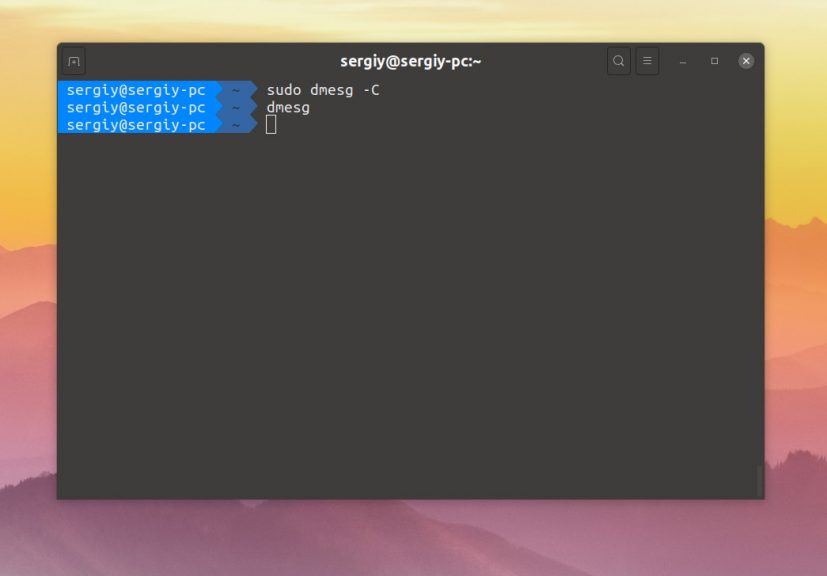
Read and Clear dmesg Logs
The -c (--read-clear) option lets you clear the dmesg log after printing it. Clearing the buffer ensures you have only valid messages from the latest reboot.
Note: To save the entire log in a file before clearing it, redirect the output to a file with sudo dmesg > log_file.
Run the following command:
sudo dmesg -cRerunning dmesg has no output since the log has been cleared.

Enable Timestamps in dmesg Logs
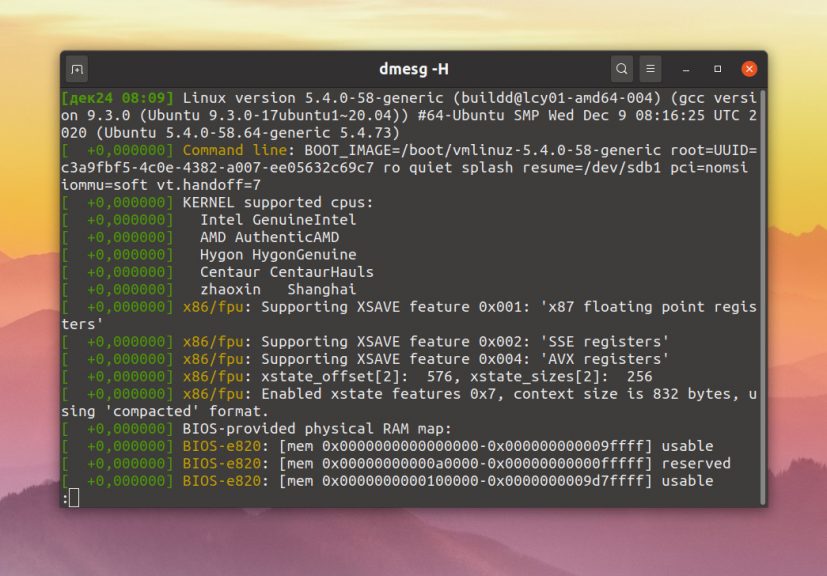
Enable timestamps in dmesg output by appending it with the -H (--human) option, which produces a human-readable output and automatically pipes the output into a pager (less).
Run the following command:
sudo dmesg -H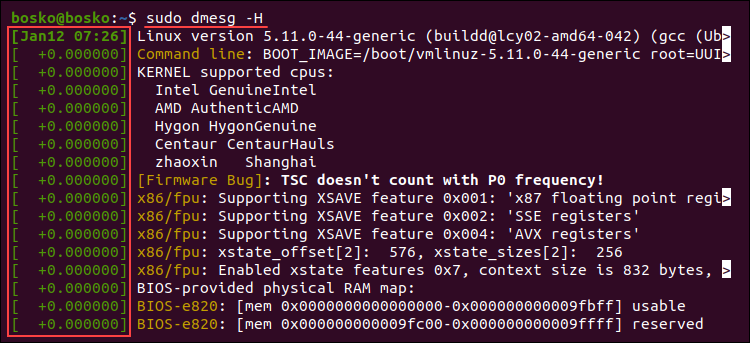
The command adds a timestamp with the date and time resolved in minutes. The events in the same minute are labeled with seconds and nanoseconds.
Quit the pager by pressing Q.
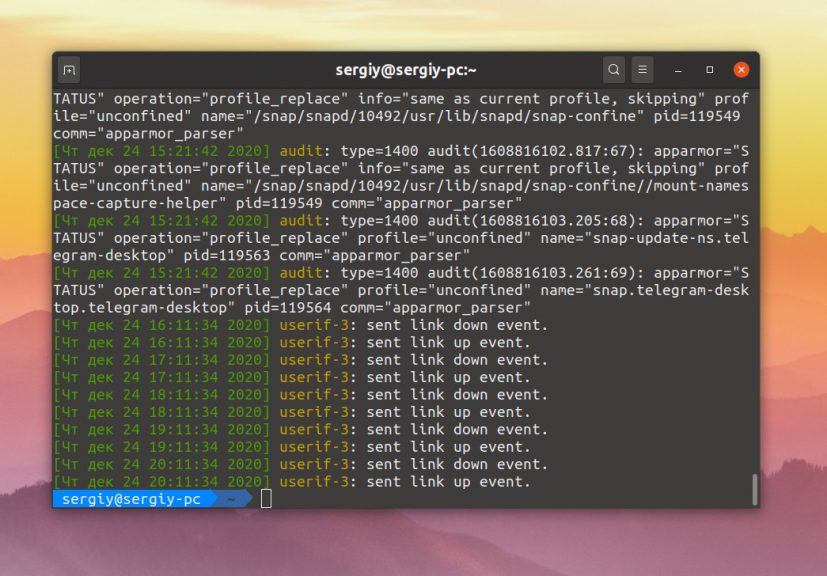
Enable Human-Readable Timestamps
Enable human-readable timestamps using the -T (--ctime) option. The option removes the nanosecond accuracy from the output, but the timestamps are easier to follow.
sudo dmesg -T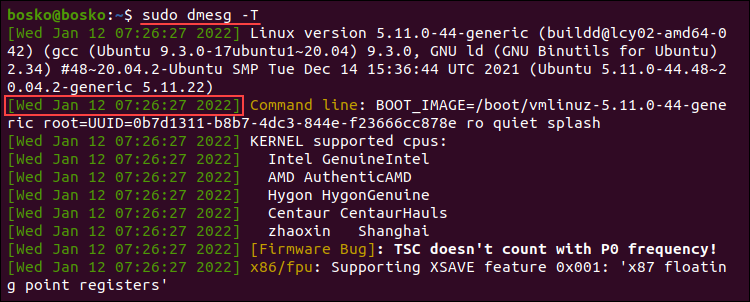
The timestamps in the output are standard dates and time, and the resolution is in minutes. The same timestamp is prepended to each action that occurred in the same minute.
Note: Unlike the -H option, the -T option doesn’t automatically invoke less.
Choose Timestamp Format
Use the --time-format [format] option to choose the timestamp format. The available formats are:
ctimereltimedeltanotimeiso
For example, to use the iso format, run:
sudo dmesg --time-format=iso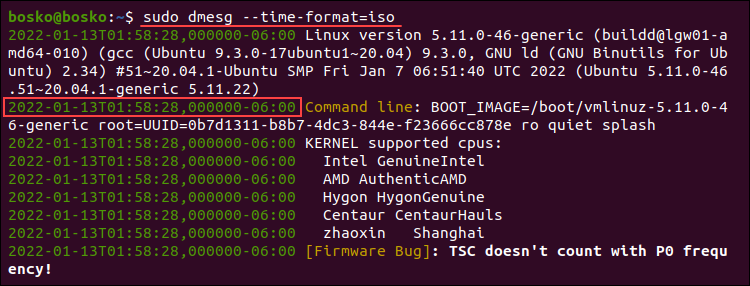
The timestamp format is now YYYY-MM-DD<T>HH:MM:SS,<microseconds>←+><timezone offset from UTC>.
Note: The iso and ctime may show inaccurate time when the system is suspended and resumed.
Limit dmesg Output to a Specific Facility
Filter the dmesg output to a specific category using the -f option. The system groups messages in the kernel ring buffer into the following facilities (categories):
kern. Kernel messages.user. User-level messages.mail. Mail system messages.daemon. Messages about system daemons.auth. Authorization messages.syslog. Internalsyslogdmessages.lpr. Line printer subsystem messages.news. Network news subsystem messages.
For example, the following command limits the output to messages related to the syslog facility:
sudo dmesg -f syslog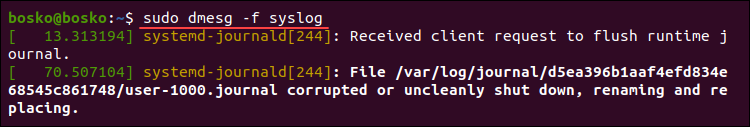
To list messages from more than one facility, specify a comma-separated list of facilities. For example:
sudo dmesg -f syslog,daemon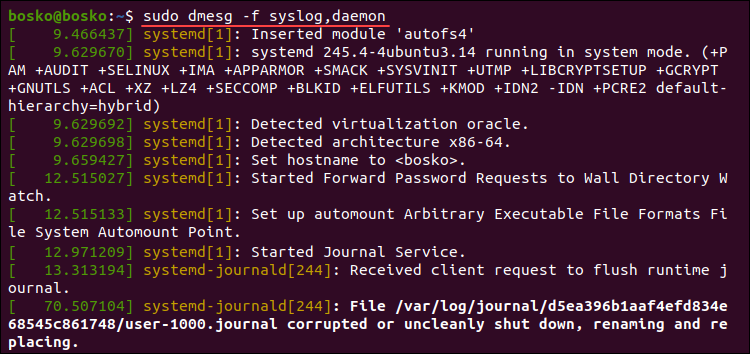
Filter Log Levels
The dmesg command associates each buffer message with a log level characterizing message importance. The available levels are:
emerg. Emergency messages.alert. Alerts requiring immediate action.crit. Critical conditions.err. Error messages.warn. Warning messages.notice. Normal but significant conditions.info. Informational messages.debug. Debugging-level messages.
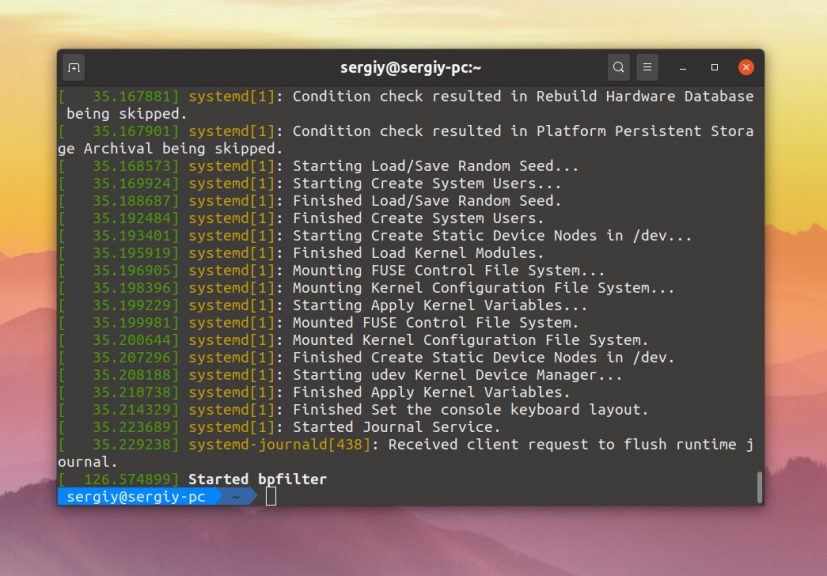
Instruct dmesg to print only the messages matching a certain level using the -l option, followed by the level name. For example:
sudo dmesg -l info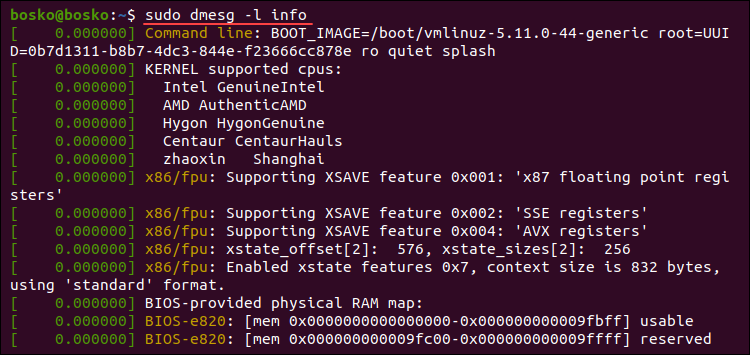
The example above extracts only informational messages from the log.
Combine multiple levels in a comma-separated list to retrieve messages from those levels. For example:
sudo dmesg -l notice,warn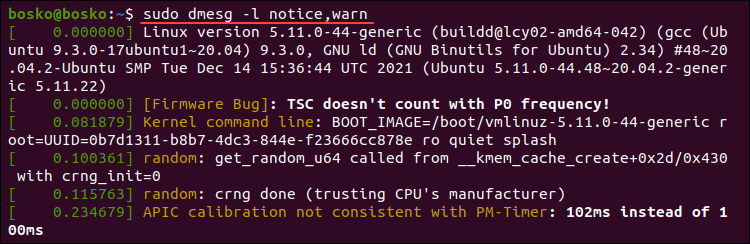
The output combines messages from the specified log levels.
Combining Facility and Level
Explicitly show each buffer message’s facility and log level at the start of each line using the -x (decode) option.
For example:
sudo dmesg -x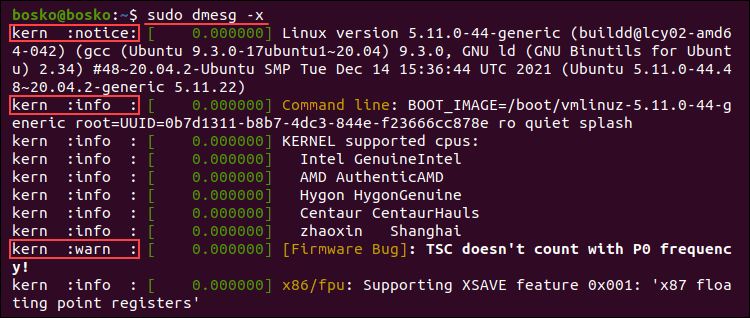
In the example above, each line is prepended with the appropriate facility and log level.
Read dmesg Log File
Each time the system boots up, the messages from the kernel ring buffer are stored in the /var/log/dmesg file. The dmesg command shows the log file contents. If you have issues using the dmesg command, open the log file in a text editor to view the contents.
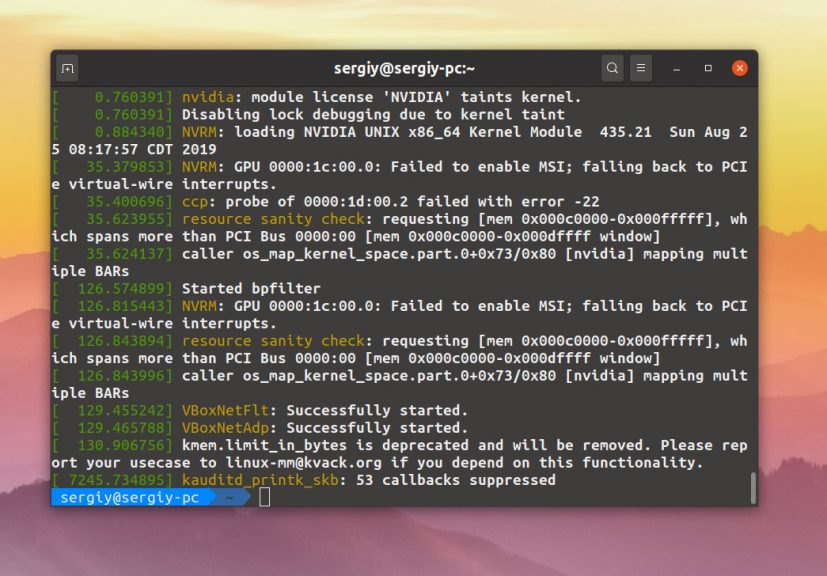
In the example below, we use the cat command to view the log file and pipe it into grep to search for a particular string occurring in the log:
cat dmesg | grep amd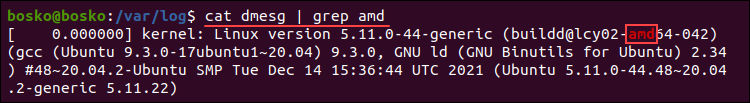
The command outputs all amd string instances in the log file.
Check for a CD Drive
Check if a remote machine is equipped with a CD drive by inspecting the buffer message log. For example, the following command shows all messages about CD devices initialized on startup:
sudo dmesg | grep -iE 'cdrom|dvd|cd/rw|cd-rom'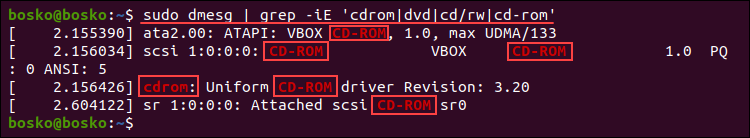
The results display information about the available CD-ROM drives, including the virtual CD-ROM drive on this machine.
Remove sudo Requirement
Removing the requirement for superuser privileges allows any user to run dmesg and view kernel ring buffer messages. Run the following command to remove the sudo requirement:
sudo sysctl -w kernel.dmesg_restrict=0
After setting the restrictions to 0, any user on the system can run dmesg.
Conclusion
This guide explained how to use the Linux dmesg command to view and control the kernel ring buffer. The utility is convenient when troubleshooting kernel or hardware issues.
For further reading, we recommend our tutorial on updating the Linux kernel in Ubuntu or checking the Kernel version in Linux.

Хотя в современных Linux-системах ядро отличается достаточно высоким уровнем стабильности, вероятность серьезных системных ошибок, тем не менее, имеется всегда. Когда происходит неисправимая ошибка, имеет место состояние, называемое паникой ядра (kernel panic): стандартный обработчик выводит на экран информацию, которая должна помочь в устранении неисправности, и входит в бесконечный цикл.
Для диагностики и анализа причин сбоев ядра разработчиками компании RedHat был разработан специализированный инструмент — kdump. Принцип его работы можно кратко описать следующим образом. Создается два ядра: основное и аварийное (именно оно используется для сбора дампа памяти). При загрузке основного ядра под аварийное ядро выделяется определенный размер памяти. При помощи kexec во время паники основного ядра загружается аварийное и собирает дамп.
В этой статье мы подробно расскажем о том, как конфигурировать kdump и анализировать с его помощью системные ошибки. Мы рассмотрим особенности работы с kdump в OC Ubuntu; в других дистрибутивах процедуры настройки и конфигурирования kdump существенно отличаются.
Установка и настройка kdump
Установим kdump с помощью команды
$ sudo apt-get install linux-crashdump kdump-tools
Настройки kdump хранятся в конфигурационном файле /etc/default/kdump-tools
# kdump-tools configuration
# ---------------------------------------------------------------------------
# USE_KDUMP - controls kdump will be configured
#     0 - kdump kernel will not be loaded
#     1 - kdump kernel will be loaded and kdump is configured
# KDUMP_SYSCTL - controls when a panic occurs, using the sysctl
#     interface.  The contents of this variable should be the
#     "variable=value ..." portion of the 'sysctl -w ' command.
#     If not set, the default value "kernel.panic_on_oops=1" will
#     be used.  Disable this feature by setting KDUMP_SYSCTL=" "
#     Example - also panic on oom:
#         KDUMP_SYSCTL="kernel.panic_on_oops=1 vm.panic_on_oom=1"
#
USE_KDUMP=1
# KDUMP_SYSCTL="kernel.panic_on_oops=1"
Чтобы активировать kdump, отредактируем этот файл и установим значение параметра USE_KDUMP=1.
Также в конфигурационном файле содержатся следующие параметры:
- KDUMP_KERNEL — полный путь к аварийному ядру;
- KDUMP_INITRD — полный путь к initrd аварийного ядра;
- KDUMP_CORE — указывает, где будет сохранен файл дампа ядра. По умолчанию дамп сохраняется в директории /var/crash (KDUMP_CORE=/var/crash);
- KDUMP_FAIL_CMD — указывает, какое действие нужно совершить в случае ошибки при сохранении дампа (по умолчанию будет выполнена команда reboot -f);
- DEBUG_KERNEL — отладочная версия работающего ядра. По умолчанию используются /usr/lib/debug/vmlinux-$. Если значение этого параметра не установлено, утилита makedumpfile создаст только дамп всех страниц памяти;
- MAKEDUMP_ARGS — содержит дополнительные аргументы, передаваемые утилите makedumpfile. По умолчанию этот параметр имеет значение ‘-c -d 31’, указывающую, что необходимо использовать сжатие и включать в дамп только используемые страницы ядра.
Установив все необходимые параметры, выполним команду update-grub и выберем install the package maintainer’s version.
Затем перезагрузим систему и убедимся в том, что kdump готов к работе:
$ cat/proc/cmdline

BOOT_IMAGE=/boot/vmlinuz-3.8.0-35-generic root=UUID=bb2ba5e1-48e1-4829-b565-611542b96018 ro crashkernel=384 -:128M quiet splash vt.handoff=7
Обратим особое внимание на параметр crashkernel=384 -:128M. Он означает, что аварийное ядро будет использовать 128 Мб памяти при загрузке. Можно прописать в grub параметр crashkernel = auto: в этом случае память под аварийное ядро будет выделяться автоматически.
Для того, чтобы мы могли анализировать дамп с помощью утилиты crash, нам понадобится также файл vmlinux, содержащий отладочную информацию:
$ sudo tee /etc/apt/sources.list.d/ddebs.list << EOF
deb http://ddebs.ubuntu.com/ $(lsb_release -cs)          main restricted universe multiverse
deb http://ddebs.ubuntu.com/ $(lsb_release -cs)-security main restricted universe multiverse
deb http://ddebs.ubuntu.com/ $(lsb_release -cs)-updates  main restricted universe multiverse
deb http://ddebs.ubuntu.com/ $(lsb_release -cs)-proposed main restricted universe multiverse
EOF
$ sudo apt-key adv --keyserver keyserver.ubuntu.com --recv-keys ECDCAD72428D7C01
$ sudo apt-get update
$ sudo apt-get install linux-image-$(uname -r)-dbgsym
По завершении установки еще раз проверим статус kdump:
$ kdump-config status
Если kdump находится в рабочем состоянии, на консоль будет выведено следующее сообщение:
current state: ready to kdump
Тестируем kdump
Вызовем панику ядра при помощи следующих команд:
echo c | sudo tee /proc/sysrq-trigger
В результате их выполнения система «зависнет».
После этого в течение нескольких минут будет создан дамп, который будет доступен в директории /var/crash после перезагрузки.
Информацию о сбое ядра можно просмотреть с помощью утилиты crash:
$ sudo crash /usr/lib/debug/boot/vmlinux-3.13.0-24-generic /var/crash/201405051934/dump.201405051934
crash 7.0.3
Copyright (C) 2002-2013  Red Hat, Inc.
Copyright (C) 2004, 2005, 2006, 2010  IBM Corporation
Copyright (C) 1999-2006  Hewlett-Packard Co
Copyright (C) 2005, 2006, 2011, 2012  Fujitsu Limited
Copyright (C) 2006, 2007  VA Linux Systems Japan K.K.
Copyright (C) 2005, 2011  NEC Corporation
Copyright (C) 1999, 2002, 2007  Silicon Graphics, Inc.
Copyright (C) 1999, 2000, 2001, 2002  Mission Critical Linux, Inc.
This program is free software, covered by the GNU General Public License,
and you are welcome to change it and/or distribute copies of it under
certain conditions.  Enter "help copying" to see the conditions.
This program has absolutely no warranty.  Enter "help warranty" for details.

GNU gdb (GDB) 7.6
Copyright (C) 2013 Free Software Foundation, Inc.
License GPLv3+: GNU GPL version 3 or later <http://gnu.org/licenses/gpl.html>
This is free software: you are free to change and redistribute it.
There is NO WARRANTY, to the extent permitted by law.  Type "show copying"
and "show warranty" for details.
This GDB was configured as "x86_64-unknown-linux-gnu"...

      KERNEL: /usr/lib/debug/boot/vmlinux-3.13.0-24-generic
    DUMPFILE: /var/crash/201405051934/dump.201405051934  [PARTIAL DUMP]
        CPUS: 4
        DATE: Mon May  5 19:34:38 2014
      UPTIME: 00:54:46
LOAD AVERAGE: 0.14, 0.07, 0.05
       TASKS: 495
    NODENAME: Ubuntu
     RELEASE: 3.13.0-24-generic
     VERSION: #46-Ubuntu SMP Thu Apr 10 19:11:08 UTC 2014
     MACHINE: x86_64  (2675 Mhz)
      MEMORY: 8 GB
       PANIC: "Oops: 0002 [#1] SMP " (check log for details)
         PID: 7826
     COMMAND: "tee"
        TASK: ffff8800a2ef8000  [THREAD_INFO: ffff8800a2e68000]
         CPU: 2
       STATE: TASK_RUNNING (PANIC)

crash>
На основе приведенного вывода мы можем заключить, что системному сбою предшествовало событие «Oops: 0002 [#1] SMP», произошедшее на CPU2 при выполнении команды tee.
Утилита crash обладает также широким спектром возможностей для диагностики причин краха ядра. Рассмотрим их более подробно.
Диагностика причин сбоя с помощью утилиты crash
Crash сохраняет информацию обо всех системных событиях, предшествовавших краху ядра. С ее помощью можно воссоздать состояние системы на момент сбоя: узнать, какие процессы были запущены на момент краха, какие файлы открыты и т.п. Эта информация помогает поставить точный диагноз и предупредить крахи ядра в будущем.
В утилите crash имеется свой набор команд:
$ crash> help
*              files          mach           repeat         timer
alias          foreach        mod            runq           tree
ascii          fuser          mount          search         union
bt             gdb            net            set            vm
btop           help           p              sig            vtop
dev            ipcs           ps             struct         waitq
dis            irq            pte            swap           whatis
eval           kmem           ptob           sym            wr
exit           list           ptov           sys            q
extend         log            rd             task

crash version: 7.0.3    gdb version: 7.6
For help on any command above, enter "help <command>".
For help on input options, enter "help input".
For help on output options, enter "help output".

crash>
Для каждой этой команды можно вызвать краткий мануал, например:
crash> help set
Все команды мы описывать не будем (с детальной информацией можно ознакомиться в официальном руководстве пользователя от компании RedHat), а расскажем лишь о наиболее важных из них.
В первую очередь следует обратить внимание на команду bt (аббревиатура от backtrace — обратная трассировка). С ее помощью можно посмотреть детальную информацию о содержании памяти ядра (подробности и примеры использования см. здесь). Однако во многих случаях для определения причины системного сбоя бывает вполне достаточно команды log, выводящее на экран содержимое буфера сообщений ядра в хронологическом порядке.
Приведем фрагмент ее вывода:
[ 3288.251955] CPU: 2 PID: 7826 Comm: tee Tainted: PF          O 3.13.0-24-generic #46-Ubuntu
[ 3288.251957] Hardware name: System manufacturer System Product Name/P7P55D LE, BIOS 2003    12/16/2010
[ 3288.251958] task: ffff8800a2ef8000 ti: ffff8800a2e68000 task.ti: ffff8800a2e68000
[ 3288.251960] RIP: 0010:[<ffffffff8144de76>]  [<ffffffff8144de76>] sysrq_handle_crash+0x16/0x20
[ 3288.251963] RSP: 0018:ffff8800a2e69e88  EFLAGS: 00010082
[ 3288.251964] RAX: 000000000000000f RBX: ffffffff81c9f6a0 RCX: 0000000000000000
[ 3288.251965] RDX: ffff88021fc4ffe0 RSI: ffff88021fc4e3c8 RDI: 0000000000000063
[ 3288.251966] RBP: ffff8800a2e69e88 R08: 0000000000000096 R09: 0000000000000387
[ 3288.251968] R10: 0000000000000386 R11: 0000000000000003 R12: 0000000000000063
[ 3288.251969] R13: 0000000000000246 R14: 0000000000000004 R15: 0000000000000000
[ 3288.251971] FS:  00007fb0f665b740(0000) GS:ffff88021fc40000(0000) knlGS:0000000000000000
[ 3288.251972] CS:  0010 DS: 0000 ES: 0000 CR0: 000000008005003b
[ 3288.251973] CR2: 0000000000000000 CR3: 00000000368fd000 CR4: 00000000000007e0
[ 3288.251974] Stack:
[ 3288.251975]  ffff8800a2e69ec0 ffffffff8144e5f2 0000000000000002 00007fff3cea3850
[ 3288.251978]  ffff8800a2e69f50 0000000000000002 0000000000000008 ffff8800a2e69ed8
[ 3288.251980]  ffffffff8144eaff ffff88021017a900 ffff8800a2e69ef8 ffffffff8121f52d
[ 3288.251983] Call Trace:
[ 3288.251986]  [<ffffffff8144e5f2>] __handle_sysrq+0xa2/0x170
[ 3288.251988]  [<ffffffff8144eaff>] write_sysrq_trigger+0x2f/0x40
[ 3288.251992]  [<ffffffff8121f52d>] proc_reg_write+0x3d/0x80
[ 3288.251996]  [<ffffffff811b9534>] vfs_write+0xb4/0x1f0
[ 3288.251998]  [<ffffffff811b9f69>] SyS_write+0x49/0xa0
[ 3288.252001]  [<ffffffff8172663f>] tracesys+0xe1/0xe6
[ 3288.252002] Code: 65 34 75 e5 4c 89 ef e8 f9 f7 ff ff eb db 0f 1f 80 00 00 00 00 66 66 66 66 90 55 c7 05 94 68 a6 00 01 00 00 00 48 89 e5 0f ae f8 <c6> 04 25 00 00 00 00 01 5d c3 66 66 66 66 90 55 31 c0 c7 05 be
[ 3288.252025] RIP  [<ffffffff8144de76>] sysrq_handle_crash+0x16/0x20
[ 3288.252028] RSP <ffff8800a2e69e88>
[ 3288.252029] CR2: 0000000000000000
В одной из строк вывода будет указано событие, вызвавшее системную ошибку:
[ 3288.251889] SysRq: Trigger a crash
С помощью команды ps можно вывести на экран список процессов, которые были запущены на момент сбоя:
crash> ps
   PID    PPID  CPU       TASK        ST  %MEM     VSZ    RSS  COMM
      0      0   0  ffffffff81a8d020  RU   0.0       0      0  [swapper]
      1      0   0  ffff88013e7db500  IN   0.0   19356   1544  init
      2      0   0  ffff88013e7daaa0  IN   0.0       0      0  [kthreadd]
      3      2   0  ffff88013e7da040  IN   0.0       0      0  [migration/0]
      4      2   0  ffff88013e7e9540  IN   0.0       0      0  [ksoftirqd/0]
      7      2   0  ffff88013dc19500  IN   0.0       0      0  [events/0]
Для просмотра информации об использовании виртуальной памяти используется команда vm:
crash> vm
PID: 5210   TASK: ffff8801396f6aa0  CPU: 0   COMMAND: "bash"
       MM              		 PGD          RSS    TOTAL_VM
ffff88013975d880  ffff88013a0c5000  1808k   108340k
      VMA           START       END     FLAGS FILE
ffff88013a0c4ed0     400000     4d4000 8001875 /bin/bash
ffff88013cd63210 3804800000 3804820000 8000875 /lib64/ld-2.12.so
ffff880138cf8ed0 3804c00000 3804c02000 8000075 /lib64/libdl-2.12.so
Команда swap выведет на консоль информацию об использовании области подкачки:
crash> swap
FILENAME           TYPE         SIZE      USED   PCT  PRIORITY
/dm-1            PARTITION    2064376k       0k   0%     -1
Информацию о прерываниях CPU можно просмотреть с помощью команды irq:
crash> irq -s
           CPU0
  0:        149  IO-APIC-edge     timer
  1:        453  IO-APIC-edge     i8042
  7:          0  IO-APIC-edge     parport0
  8:          0  IO-APIC-edge     rtc0
  9:          0  IO-APIC-fasteoi  acpi
 12:        111  IO-APIC-edge     i8042
 14:        108  IO-APIC-edge     ata_piix
Вывести на консоль список файлов, открытых на момент сбоя, можно с помощью команды files:
crash> files
PID: 5210   TASK: ffff8801396f6aa0  CPU: 0   COMMAND: "bash"
ROOT: /    CWD: /root
 FD       FILE            DENTRY           INODE       TYPE PATH
  0 ffff88013cf76d40 ffff88013a836480 ffff880139b70d48 CHR  /tty1
  1 ffff88013c4a5d80 ffff88013c90a440 ffff880135992308 REG  /proc/sysrq-trigger
255 ffff88013cf76d40 ffff88013a836480 ffff880139b70d48 CHR  /tty1
Наконец, получить в сжатом виде информацию об общем состоянии системы можно с помощью команды sys:
crash> sys
      KERNEL: /usr/lib/debug/lib/modules/2.6.32-431.5.1.el6.x86_64/vmlinux
    DUMPFILE: /var/crash/127.0.0.1-2014-03-26-12:24:39/vmcore  [PARTIAL DUMP]
        CPUS: 1
        DATE: Wed Mar 26 12:24:36 2014
      UPTIME: 00:01:32
LOAD AVERAGE: 0.17, 0.09, 0.03
       TASKS: 159
    NODENAME: elserver1.abc.com
     RELEASE: 2.6.32-431.5.1.el6.x86_64
     VERSION: #1 SMP Fri Jan 10 14:46:43 EST 2014
     MACHINE: x86_64  (2132 Mhz)
      MEMORY: 4 GB
       PANIC: "Oops: 0002 [#1] SMP " (check log for details)
Заключение
Анализ и диагностика причин падения ядра представляет собой очень специфическую и сложную тему, которую невозможно уместить в рамки одной статьи. Мы еще вернемся к ней в следующих публикациях.
Для желающих узнать больше — несколько полезных ссылок:
- Документация kdump на сайте kernel.org
- Книга, целиком посвященная проблемам диагностики сбоев ядра
- Подробная документация для утилиты crash
Читателей, которые не могут оставлять комментарии здесь, приглашаем к нам в блог.
Ядро Linux, как и другие программы может и выводит различные информационные сообщения и сообщения об ошибках. Все они выводятся в буфер сообщения ядра, так называемый kernel ring buffer. Основная причина существования этого буфера — надо сохранить сообщения, которые возникают во время загрузки системы пока сервис Syslog ещё не запущен и не может их собирать.
Для получения сообщений из этого буфера можно просто прочитать файл /var/log/dmesg. Однако, более удобно это можно сделать с помощью команды dmesg. В этой статье мы рассмотрим как пользоваться dmesg. Разберемся с опциями утилиты, а также приведем примеры работы с ней.
Синтаксис команды dmesg очень простой. Надо набрать имя команды и если необходимо, то опции:
$ dmesg опции
Опции позволяют управлять выводом, добавлять или скрывать дополнительную информацию и делать просмотр сообщений более удобным. Вот они:
- -C, —clear — очистить буфер сообщений ядра;
- -c, —read-clear — вывести сообщения из буфера ядра, а затем очистить его;
- -d, —show-delta — выводит время прошедшее между двумя сообщениями;
- -f, —facility — выводить только сообщения от подсистем определенной категории;
- -H, —human — включить вывод, удобный для человека;
- -k, —kernel — отображать только сообщения ядра;
- -L, —color — сделать вывод цветным, автоматически включается при использовании опции -H;
- -l, —level — ограничить вывод указанным уровнем подробности;
- -P, —nopager — выводить информацию обычным текстом, не добавлять постраничную навигацию;
- -r, —raw — печатать сообщения как есть, не убирая служебные префиксы;
- -S, —syslog — использовать Syslog для чтения сообщений от ядра, по умолчанию используется файл /dev/kmsg;
- -T, —ctime — выводить время в удобном для человека формате;
- -t, —notime — не выводить время поступления сообщения;
- -u, —userspace — показывать только сообщения от программ из пространства пользователя;
- -w, —follow — после вывода всех сообщений не завершать программу, а ждать новых;
- -x, —decode — выводить категорию и уровень журналирования в удобном для чтения формате.
Это далеко не все опции, а только самые интересные. Если вы хотите посмотреть другие, воспользуйтесь такой командой:
man dmesg
Поддерживаемые категории журналирования:
- kern — сообщения от ядра;
- user — сообщения от программ пространства пользователя;
- mail — сообщения от сервисов почты;
- daemon — сообщения от системных служб;
- auth — сообщения безопасности и информации об авторизации пользователей;
- syslog — сообщения, отправляемые сервисом Syslogd;
- lpr — сообщения от служб печати.
А вот доступные уровни журналирования:
- emerg — ошибка привела к неработоспособности системы;
- alert — требуется вмешательство пользователя;
- crit — критическая ошибка;
- err — обычная ошибка;
- warn — предупреждение;
- notine — замечание;
- info — информация;
- debug — отладочное сообщение.
Примеры использования dmesg
Как вы уже поняли команда dmesg показывает не только сообщения от ядра, но и другие сообщения от системных служб, например, от системы инициализации systemd. Чтобы вывести вообще все сообщения выполните команду без опций:
dmesg
По умолчанию перед сообщением выводится только временной сдвиг от загрузки системы. Если вы хотите полную временную метку, используйте опцию -T:
dmesg -T
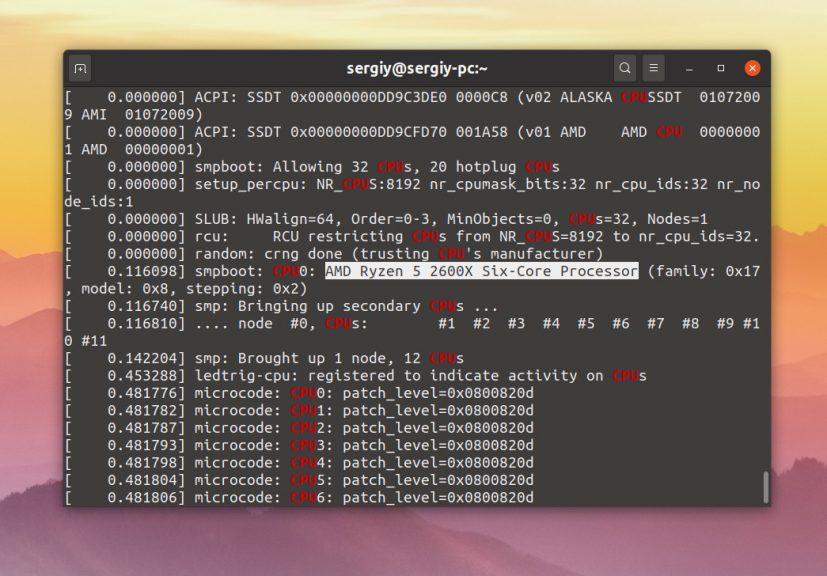
Во время загрузки ядро тестирует оборудование и выводит подробную информацию о нём в буфер сообщений ядра. Таким образом, с помощью dmesg можно посмотреть информацию об оборудовании, просто отфильтруйте нужные данные, например CPU:
dmesg | grep CPU
Для того чтобы выводить только сообщения от ядра, а не всё под ряд, используйте опцию -k:
dmesg -k
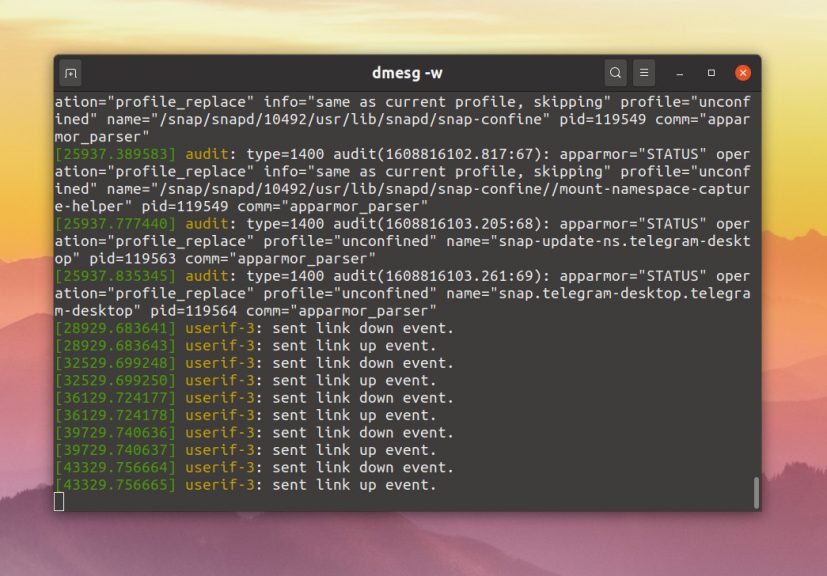
Теперь в выводе утилиты не будет сообщений от Systemd. Если вы хотите выводить все сообщения ядра в реальном времени, используйте опцию -w:
dmesg -w
Для того чтобы добавить цвет к выводу и включить постраничную навигацию вместо вывода текста одним большим куском используйте опцию -H:
dmesg -H
Для того чтобы вывести категорию сообщения и его уровень логирования используйте опцию -x:
dmesg -x
Если вас интересуют только ошибки, можно отсеять их по уровню журналирования:
dmesg -l crit,err
Или только информационные сообщения:
dmesg -l warn
Можно вывести только сообщения, которые попали сюда из пространства пользователя, для этого используйте опцию -u:
dmesg -u
Или же отфильтруйте категории user и daemon с помощью опции -f:
dmesg -f user,daemon
Аналогичным образом вы можете фильтровать и другие категории. Если вы хотите очистить буфер сообщений ядра, используйте опцию -C. При следующем запуске dmesg там будет пусто:
dmesg -C
Выводы
В этой небольшой статье мы разобрали как пользоваться dmesg. Теперь вы знаете за что отвечает эта утилита, а также какие опции можно использовать.
Обнаружили ошибку в тексте? Сообщите мне об этом. Выделите текст с ошибкой и нажмите Ctrl+Enter.

Статья распространяется под лицензией Creative Commons ShareAlike 4.0 при копировании материала ссылка на источник обязательна .
Об авторе
![]()
Основатель и администратор сайта losst.ru, увлекаюсь открытым программным обеспечением и операционной системой Linux. В качестве основной ОС сейчас использую Ubuntu. Кроме Linux, интересуюсь всем, что связано с информационными технологиями и современной наукой.
The ‘dmesg‘ command displays the messages from the kernel ring buffer. A system passes multiple runlevel from where we can get lot of information like system architecture, cpu, attached device, RAM etc. When computer boots up, a kernel (core of an operating system) is loaded into memory. During that period number of messages are being displayed where we can see hardware devices detected by kernel.
Read Also: 10 Linux Commands to Collect System and Hardware Information

The messages are very important in terms of diagnosing purpose in case of device failure. When we connect or disconnect hardware device on the system, with the help of dmesg command we come to know detected or disconnected information on the fly. The dmesg command is available on most Linux and Unix based Operating System.
Let’s throw some light on most famous tool called ‘dmesg’ command with their practical examples as discussed below. The exact syntax of dmesg as follows.
# dmseg [options...]
1. List all loaded Drivers in Kernel
We can use text-manipulation tools i.e. ‘more‘, ‘tail‘, ‘less‘ or ‘grep‘ with dmesg command. As output of dmesg log won’t fit on a single page, using dmesg with pipe more or less command will display logs in a single page.
[[email protected] ~]# dmesg | more
[[email protected] ~]# dmesg | less
Sample Output
[    0.000000] Initializing cgroup subsys cpuset
[    0.000000] Initializing cgroup subsys cpu
[    0.000000] Initializing cgroup subsys cpuacct
[    0.000000] Linux version 3.11.0-13-generic ([email protected]) (gcc version 4.8.1 (Ubuntu/Linaro 4.8.1-10ubuntu8) ) #20-Ubuntu SMP Wed Oct 23 17:26:33 UTC 2013
(Ubuntu 3.11.0-13.20-generic 3.11.6)
[    0.000000] KERNEL supported cpus:
[    0.000000]   Intel GenuineIntel
[    0.000000]   AMD AuthenticAMD
[    0.000000]   NSC Geode by NSC
[    0.000000]   Cyrix CyrixInstead
[    0.000000]   Centaur CentaurHauls
[    0.000000]   Transmeta GenuineTMx86
[    0.000000]   Transmeta TransmetaCPU
[    0.000000]   UMC UMC UMC UMC
[    0.000000] e820: BIOS-provided physical RAM map:
[    0.000000] BIOS-e820: [mem 0x0000000000000000-0x000000000009fbff] usable
[    0.000000] BIOS-e820: [mem 0x00000000000f0000-0x00000000000fffff] reserved
[    0.000000] BIOS-e820: [mem 0x0000000000100000-0x000000007dc08bff] usable
[    0.000000] BIOS-e820: [mem 0x000000007dc08c00-0x000000007dc5cbff] ACPI NVS
[    0.000000] BIOS-e820: [mem 0x000000007dc5cc00-0x000000007dc5ebff] ACPI data
[    0.000000] BIOS-e820: [mem 0x000000007dc5ec00-0x000000007fffffff] reserved
[    0.000000] BIOS-e820: [mem 0x00000000e0000000-0x00000000efffffff] reserved
[    0.000000] BIOS-e820: [mem 0x00000000fec00000-0x00000000fed003ff] reserved
[    0.000000] BIOS-e820: [mem 0x00000000fed20000-0x00000000fed9ffff] reserved
[    0.000000] BIOS-e820: [mem 0x00000000fee00000-0x00000000feefffff] reserved
[    0.000000] BIOS-e820: [mem 0x00000000ffb00000-0x00000000ffffffff] reserved
[    0.000000] NX (Execute Disable) protection: active
.....
Read Also: Manage Linux Files Effectively using commands head, tail and cat
2. List all Detected Devices
To discover which hard disks has been detected by kernel, you can search for the keyword “sda” along with “grep” like shown below.
[[email protected] ~]# dmesg | grep sda

[    1.280971] sd 2:0:0:0: [sda] 488281250 512-byte logical blocks: (250 GB/232 GiB)
[    1.281014] sd 2:0:0:0: [sda] Write Protect is off
[    1.281016] sd 2:0:0:0: [sda] Mode Sense: 00 3a 00 00
[    1.281039] sd 2:0:0:0: [sda] Write cache: enabled, read cache: enabled, doesn't support DPO or FUA
[    1.359585]  sda: sda1 sda2 < sda5 sda6 sda7 sda8 >
[    1.360052] sd 2:0:0:0: [sda] Attached SCSI disk
[    2.347887] EXT4-fs (sda1): mounted filesystem with ordered data mode. Opts: (null)
[   22.928440] Adding 3905532k swap on /dev/sda6.  Priority:-1 extents:1 across:3905532k FS
[   23.950543] EXT4-fs (sda1): re-mounted. Opts: errors=remount-ro
[   24.134016] EXT4-fs (sda5): mounted filesystem with ordered data mode. Opts: (null)
[   24.330762] EXT4-fs (sda7): mounted filesystem with ordered data mode. Opts: (null)
[   24.561015] EXT4-fs (sda8): mounted filesystem with ordered data mode. Opts: (null)
NOTE: The ‘sda’ first SATA hard drive, ‘sdb’ is the second SATA hard drive and so on. Search with ‘hda’ or ‘hdb’ in the case of IDE hard drive.
3. Print Only First 20 Lines of Output
The ‘head’ along with dmesg will show starting lines i.e. ‘dmesg | head -20’ will print only 20 lines from the starting point.
[[email protected] ~]# dmesg | head  -20

[    0.000000] Initializing cgroup subsys cpuset
[    0.000000] Initializing cgroup subsys cpu
[    0.000000] Initializing cgroup subsys cpuacct
[    0.000000] Linux version 3.11.0-13-generic ([email protected]) (gcc version 4.8.1 (Ubuntu/Linaro 4.8.1-10ubuntu8) ) #20-Ubuntu SMP Wed Oct 23 17:26:33 UTC 2013 (Ubuntu 3.11.0-13.20-generic 3.11.6)
[    0.000000] KERNEL supported cpus:
[    0.000000]   Intel GenuineIntel
[    0.000000]   AMD AuthenticAMD
[    0.000000]   NSC Geode by NSC
[    0.000000]   Cyrix CyrixInstead
[    0.000000]   Centaur CentaurHauls
[    0.000000]   Transmeta GenuineTMx86
[    0.000000]   Transmeta TransmetaCPU
[    0.000000]   UMC UMC UMC UMC
[    0.000000] e820: BIOS-provided physical RAM map:
[    0.000000] BIOS-e820: [mem 0x0000000000000000-0x000000000009fbff] usable
[    0.000000] BIOS-e820: [mem 0x00000000000f0000-0x00000000000fffff] reserved
[    0.000000] BIOS-e820: [mem 0x0000000000100000-0x000000007dc08bff] usable
[    0.000000] BIOS-e820: [mem 0x000000007dc08c00-0x000000007dc5cbff] ACPI NVS
[    0.000000] BIOS-e820: [mem 0x000000007dc5cc00-0x000000007dc5ebff] ACPI data
[    0.000000] BIOS-e820: [mem 0x000000007dc5ec00-0x000000007fffffff] reserved
4. Print Only Last 20 Lines of Output
The ‘tail’ along with dmesg command will print only 20 last lines, this is useful in case we insert removable device.
[[email protected] ~]# dmesg | tail -20

parport0: PC-style at 0x378, irq 7 [PCSPP,TRISTATE]
ppdev: user-space parallel port driver
EXT4-fs (sda1): mounted filesystem with ordered data mode
Adding 2097144k swap on /dev/sda2.  Priority:-1 extents:1 across:2097144k
readahead-disable-service: delaying service auditd
ip_tables: (C) 2000-2006 Netfilter Core Team
nf_conntrack version 0.5.0 (16384 buckets, 65536 max)
NET: Registered protocol family 10
lo: Disabled Privacy Extensions
e1000: eth0 NIC Link is Up 1000 Mbps Full Duplex, Flow Control: None
Slow work thread pool: Starting up
Slow work thread pool: Ready
FS-Cache: Loaded
CacheFiles: Loaded
CacheFiles: Security denies permission to nominate security context: error -95
eth0: no IPv6 routers present
type=1305 audit(1398268784.593:18630): audit_enabled=0 old=1 auid=4294967295 ses=4294967295 res=1
readahead-collector: starting delayed service auditd
readahead-collector: sorting
readahead-collector: finished
5. Search Detected Device or Particular String
It’s difficult to search particular string due to length of dmesg output. So, filter the lines with are having string like ‘usb‘ ‘dma‘ ‘tty‘ and ‘memory‘ etc. The ‘-i’ option instruct to grep command to ignore the case (upper or lower case letters).
[[email protected] log]# dmesg | grep -i usb
[[email protected] log]# dmesg | grep -i dma
[[email protected] log]# dmesg | grep -i tty
[[email protected] log]# dmesg | grep -i memory
Sample Output
[    0.000000] Scanning 1 areas for low memory corruption
[    0.000000] initial memory mapped: [mem 0x00000000-0x01ffffff]
[    0.000000] Base memory trampoline at [c009b000] 9b000 size 16384
[    0.000000] init_memory_mapping: [mem 0x00000000-0x000fffff]
[    0.000000] init_memory_mapping: [mem 0x37800000-0x379fffff]
[    0.000000] init_memory_mapping: [mem 0x34000000-0x377fffff]
[    0.000000] init_memory_mapping: [mem 0x00100000-0x33ffffff]
[    0.000000] init_memory_mapping: [mem 0x37a00000-0x37bfdfff]
[    0.000000] Early memory node ranges
[    0.000000] PM: Registered nosave memory: [mem 0x0009f000-0x000effff]
[    0.000000] PM: Registered nosave memory: [mem 0x000f0000-0x000fffff]
[    0.000000] please try 'cgroup_disable=memory' option if you don't want memory cgroups
[    0.000000] Memory: 2003288K/2059928K available (6352K kernel code, 607K rwdata, 2640K rodata, 880K init, 908K bss, 56640K reserved, 1146920K highmem)
[    0.000000] virtual kernel memory layout:
[    0.004291] Initializing cgroup subsys memory
[    0.004609] Freeing SMP alternatives memory: 28K (c1a3e000 - c1a45000)
[    0.899622] Freeing initrd memory: 23616K (f51d0000 - f68e0000)
[    0.899813] Scanning for low memory corruption every 60 seconds
[    0.946323] agpgart-intel 0000:00:00.0: detected 32768K stolen memory
[    1.360318] Freeing unused kernel memory: 880K (c1962000 - c1a3e000)
[    1.429066] [drm] Memory usable by graphics device = 2048M
6. Clear dmesg Buffer Logs
Yes, we can clear dmesg logs if required with below command. It will clear dmesg ring buffer message logs till you executed the command below. Still you can view logs stored in ‘/var/log/dmesg‘ files. If you connect any device will generate dmesg output.
[[email protected] log]# dmesg -c
7. Monitoring dmesg in Real Time
Some distro allows command ‘tail -f /var/log/dmesg’ as well for real time dmesg monitoring.
[[email protected] log]# watch "dmesg | tail -20"
Conclusion: The dmesg command is useful as dmesg records all the system changes done or occur in real time. As always you can man dmesg to get more information.
Kernel is one of the most important components of a Linux operation system. This core component controls system resources including CPU and memory. When your system boots up and then performs various operations, the kernel writes several messages to the ring buffer. Linux system administrators can display these operating system operation messages using the dmesg command.
In this tutorial, we will learn how to use the dmesg command in Linux.
Prerequisites
- A Linux computer with terminal access.
- Basic understanding of the Linux commands.
- Sudo or root user account privileges to execute the commands.
Linux Ring Buffer
When you start your Linux operating system, certain events occur, such as the kernel being loaded into the main memory. This process and all the processes after that write certain log messages to the ring buffer that system administrators use to troubleshoot device failure and system problems.
The Linux kernel ring buffer is a physical memory part that stores log messages generated by the kernel. It is a fixed size buffer and when it gets full the older logs are automatically deleted to make space for the new logs.
This buffer contains data such as device drive initialization messages, hardware messages, and kernel-related messages.
Dmesg, also known as display message, prints all the log messages that are stored in the ring buffer. The default command output contains various fields and messages that include logs produced by device drivers, hardware devices, and other critical system components. Dmesg can also be used to control the kernel ring buffer.
The Linux dmesg command lets you read the kernel log messages from the virtual files in the /proc/kmsg virtual file system. This log file can be opened by only one process at a time. This command will hang if you try to display the log file contents using the cat command while the Syslog process is running. The kernel log messages are stored to the /var/log/dmesg by the Syslog daemon.
The basic syntax of dmesg is:
sudo dmesg [options]Linux Dmesg Command Examples
The following examples will show you some of the most common use cases of this command.
Dmesg without any Options
By default, the dmesg command displays all the log messages that are stored in the kernel buffer:
sudo dmesg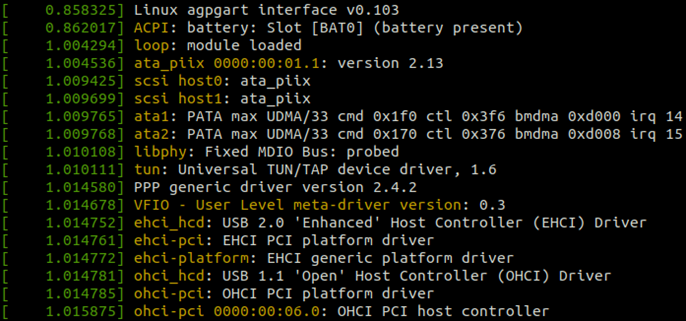
The default output shows the following three parts of information:
- Time, which displays the number of seconds since the boot time when the message was created. If the displayed time is 1.004294, then it means the log message was created 1 second after the boot time.
- Device, which displays the component for which the message was created.
- Message, which displays the actual operation.
Retrieve Messages
By default, all the messages are displayed, but the list is very long. Use the following command to display the last 10 messages:
sudo dmesg | tail -10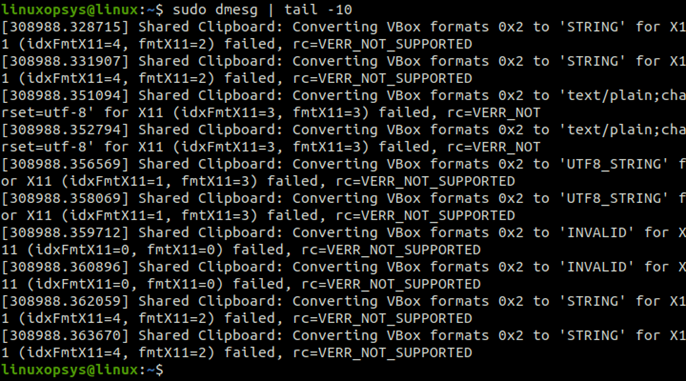
To display the first 10 messages in the kernel buffer, type:
sudo dmesg | head -10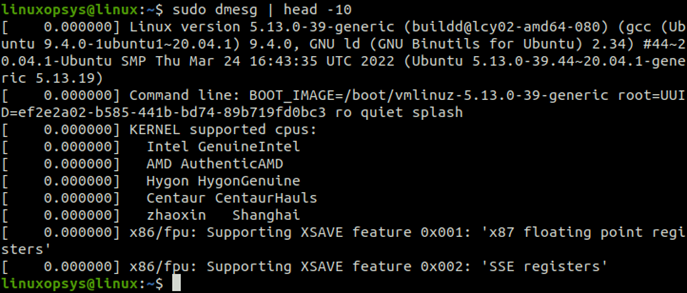
You can also use the cat command and grep command to show logs that match the specified component name or string:
cat dmesg | grep CPU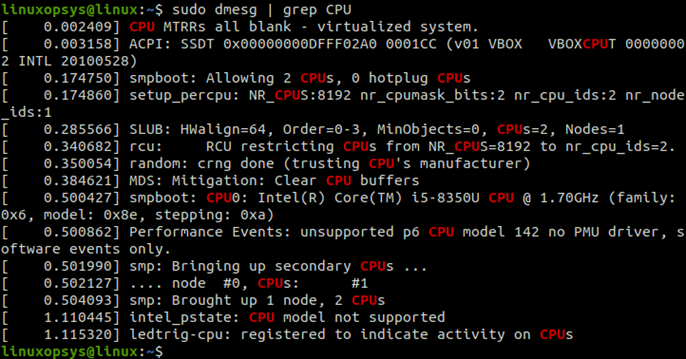
Add or Enable Timestamps
If the timestamp is enabled, then you can print timestamp in the dmesg output. Use the following command to check if the timestamp is enabled:
cat /sys/module/printk/parameters/timeIf the output of this command is Y, it means the timestamp is enabled. Use the following command to enable timestamp if it is disabled:
echo Y > /sys/module/printk/parameters/timeTo print kernel’s timestamps plus the number of seconds after the specified timestamp, use the -H option:
sudo dmesg -H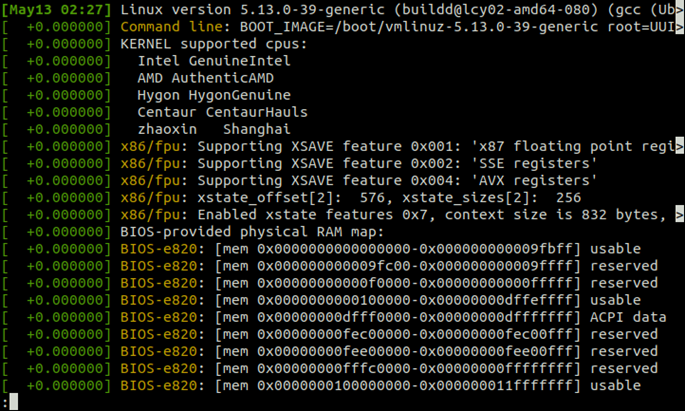
The timestamp is displayed in the first line of the output. The rest of the entries display the number of seconds after the specified timestamp. The -H option shows one screen output at a time, and you can display the next message by pressing Enter key.
Show Human Readable Timestamps
To display the complete human-readable timestamps, use the -T option:
sudo dmesg -T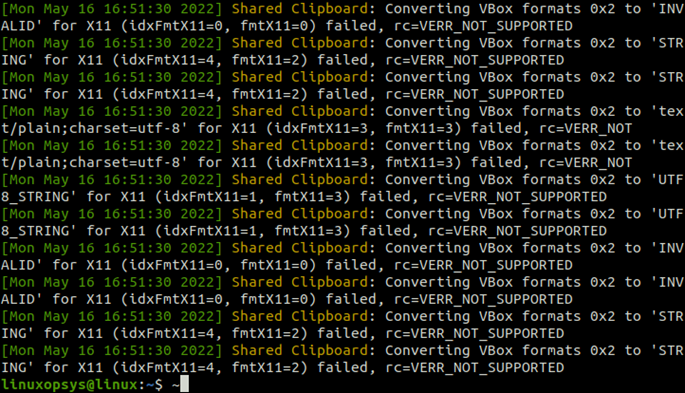
Timestamp Format
You can also specify the timestamp format based on your requirements. The supported timestamp format options are ctime, reltime, delta, notime, and iso. Use the following command to display the timestamp in the iso format:
sudo dmesg --time-format=iso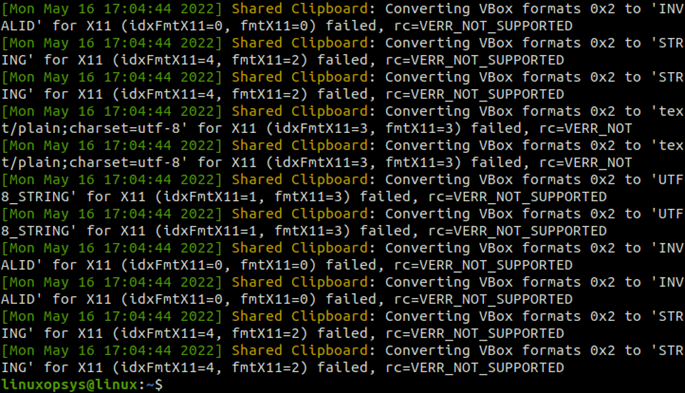
You can also use a custom date format for the timestamp:
sudo dmesg --ctime
Colored Messages
You can enable or disable colored output in the dmesg command. Color is enabled in our system, so the color output is displayed by default. To display colored messages, use the following command:
sudo dmesg –-color=never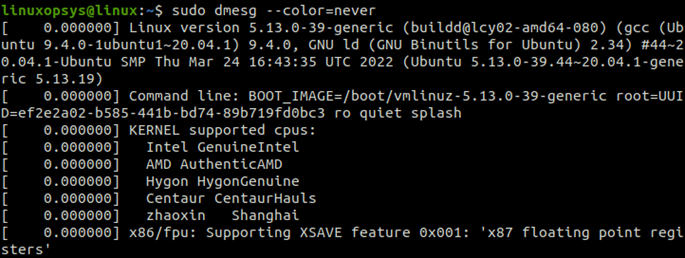
If the color is disabled, then use the sudo dmesg —color=always command.
Watching Live Messages
To display new messages as they arrive, use the following command:
sudo dmesg --followSearch for Specific Terms
You can search for specific terms in the kernel ring buffer log messages using the grep command with dmesg. To search for messages about memory, type:
sudo dmesg | grep memory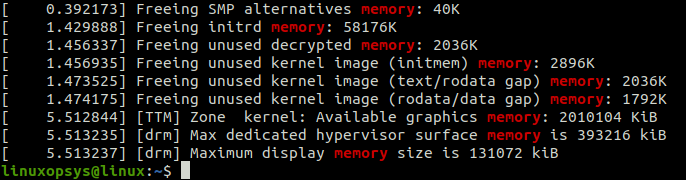
To search for messages about USB drive, type:
sudo dmesg | grep -i usb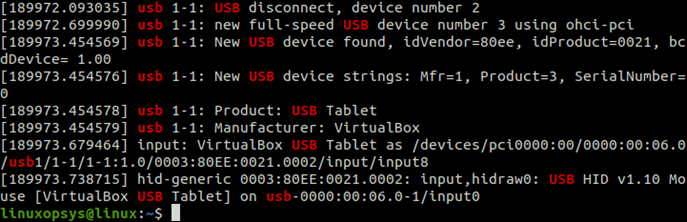
To display messages about serial ports, type:
sudo dmesg | grep -i tty
To search for messages about network connections, type:
sudo dmesg | grep -i eth0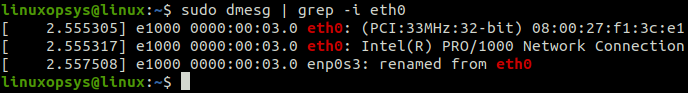
To search for messages about the hard drives, type:
sudo dmesg | grep -i sda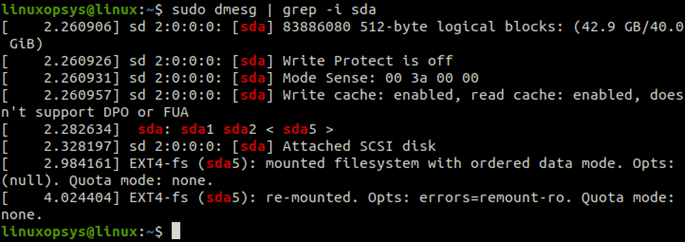
To display messages about both USB and memory, type:
sudo dmesg | grep -E "usb|memory"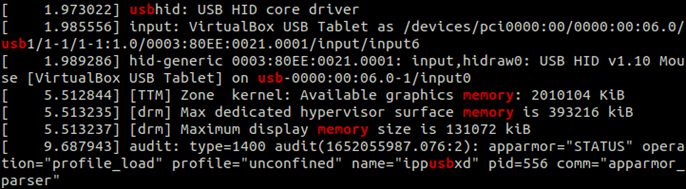
To check for a CD Drive in your system, type:
sudo dmesg | grep -iE 'cdrom|dvd|cd/rw|cd-rom'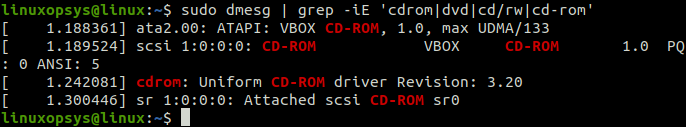
Specific Facility
The default dmesg output includes log messages about all the system components. You can filter these messages based on the processes that initiated the messages:
- kern represents kernel messages.
- user represents user-level messages.
- mail represents mail system messages.
- daemon displays messages about the system daemons.
- auth displays user authorization messages.
- Syslog represents internal syslogd messages.
- lpr displays messages created by the line printer subsystem.
- news displays messages created by the network news subsystem.
Specify the appropriate facility name with the dmesg command to display messages that are created by a particular facility. For example, to show messages about daemon, use the following command:
sudo dmesg --facility=daemon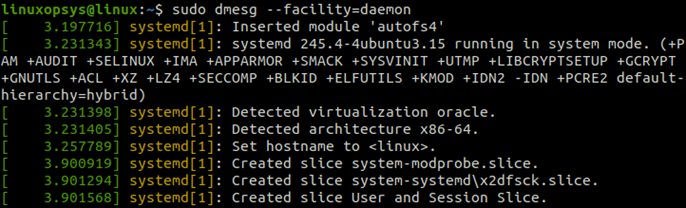
Log Levels
Every message logged in the buffer has a level that represents the severity or significance of the message. The following log levels are supported:
- emerg shows emergency messages.
- alert shows system alerts that require immediate attention.
- crit shows critical system conditions.
- err shows application or system error logs.
- warn shows warning messages.
- notice shows normal but important messages.
- info shows only informational messages.
- debug shows debug level messages. System administrators can troubleshoot kernel issues using debug-level messages.
To display only the warnings, specify the log level as warn:
sudo dmesg --level=warn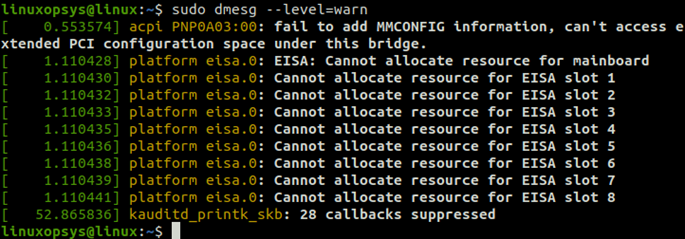
Combining Facility and Level
To display messages that include both log-level and facilities in human-readable output, use the -x option:
sudo dmesg -x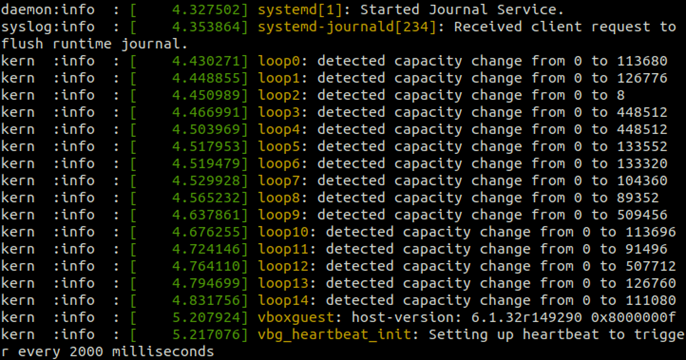
Remove Sudo
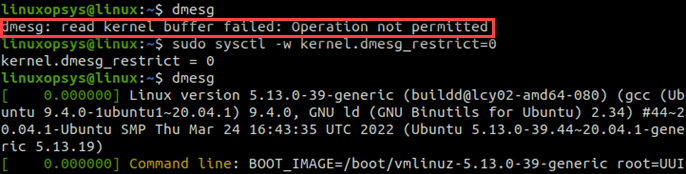
In some Linux distributions, by default, non-root users may not run the dmesg command. You can remove this restriction to enable access for non-root users:
sudo sysctl -w kernel.dmesg_restrict=0
Clear Dmesg Messages
Use the -c option to first print the dmesg output and then clear dmesg logs from the kernel ring buffer:
sudo dmesg -c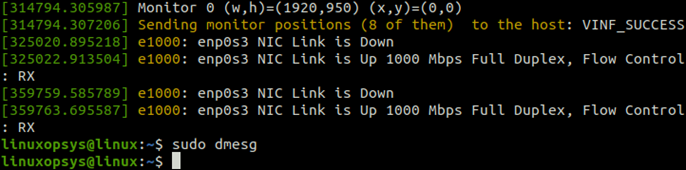
To clear all messages without printing the output, use the -C option:
sudo dmesg -CThe dmesg log messages are automatically written to the /var/log/kern.log and /var/log/dmesg files. Log messages from these files are available even if you clear the dmesg messages using -c or -C options.
Stop Dmesg from Logging to Console
You can disable the printing of log messages in the dmesg command console, use the -D option:
sudo dmesg -DTo enable the printing of log messages, use the –E option:
sudo dmesg -EThe Dmesg Command Options
The following table describes some of the most commonly used options of this command:
| Option | Description |
-C |
Clears the kernel ring buffer. |
-c |
Prints the kernel ring buffer messages before clearing. |
-f |
Restricts the output to a particular facility. |
-H |
Prints output in a human-readable format. |
-L |
Prints colored output. |
-l |
Restricts the output to a particular log level. |
-S |
Instructs dmesg to read kernel messages from Syslog. |
-s |
Specifies buffer size for the kernel ring buffer. |
-T |
Prints human-readable log message timestamps. |
-t |
Omits timestamps in dmesg output. |
--time-format |
Prints output in the specified time format. |
-w, --follow |
Updates dmesg output automatically. |
-x |
Prints facility and level combined output. |
Conclusion
In this tutorial, we learned how to use the dmesg command in Linux to print kernel ring buffer log messages on the user console. Try examples in this command to learn the command options and effectively use the dmesg command.
For more information, you can browse to dmesg man pages.