If your system has crashed and experienced a Blue Screen of Death (BSoD), or a program or Windows feature suddenly crashes, Windows automatically generates a record of the conditions and
If your system has crashed and experienced a Blue Screen of Death (BSoD), or a program or Windows feature suddenly crashes, Windows automatically generates a record of the conditions and circumstances under which the error occurred. This information is stored in dump files with the extension “.dmp.”
These dump files can help troubleshoot the root cause of the error so that it does not occur again.
This article contains everything you need to know about these dump files and how they can be opened in Windows, since there is no native method, so they can be analyzed to determine the cause of the error.
Table of contents
-
Windows Crash Dump Files
-
Types of Dump Files
- Complete Memory Dump
- Kernel Memory Dump
- Small Memory Dump/Mini Memory Dump
-
Types of Dump Files
-
How to Read and Analyze DMP Files
-
Using WinDbg
- Download and Install WinDbg
- Open and Analyze dmp files using WinDbg
- Using WhoCrashed
- Using BlueScreenView
-
Using WinDbg
- Final Thoughts
Windows Crash Dump Files
Crash dump files, also known as “mini-dump files,” are system-generated binary files that contain various information about a crash that may have occurred on your computer. Like Event Viewer, these files can be used to determine the cause of the error, and then use that data to fix it. Dump files can contain the following data in them, which can be helpful for the matter:
The list below highlights the content which can be found inside a mini-dump file.
- The Stop message (error code), its parameters, and other data.
- List of loaded drivers.
- The processor context (PRCB) for the processor that stopped.
- Process information and kernel context (EPROCESS) for the process stopped.
- Process information and kernel context (ETHREAD) for the thread stopped.
- Kernel-mode call stack for the thread that stopped.
Dump files are created by copying the data off the system memory and onto the computer’s storage. It uses the Windows Page File and requires at least 2MB of free space. With this information, you can understand how different dump files are created.
Windows can write debugging information in three types of dump files.
Types of Dump Files
Complete Memory Dump
Complete Memory Dump files are the largest of the dump files. In this case, the complete contents of the memory are written onto the dump file.
When generated by the system, all old Complete Memory Dump files are replaced and overwritten.
Complete Memory Dump files are saved to C:WindowsMEMORY.DMP file.
Kernel Memory Dump
Kernel Memory Dump files only contain data from kernel memory, which is why they are relatively smaller in size. Such files do not contain data from any unused, unallocated memory or the memory used by user-mode programs.
When generated by the system, all old Kernel Memory Dump files are replaced and overwritten.
Kernel Memory Dump files are also saved to C:WindowsMEMORY.DMP file, the same as Complete Memory Dump files. However, only one of these is saved at a time and is overwritten when another crash occurs.
Small Memory Dump/Mini Memory Dump
The minidump file, which we will discuss in this post, is the smallest kind of dump file. This file contains the information described above that can assist in determining the cause of the crash.
Minidump files generated by the system are not overwritten. Instead, a new one is generated.
Minidump files can be found at C:WindowsMinidump. If you do not find a directory named “Minidump,” it is likely because a dump file has not been created yet.
When a minidump file is created, Windows automatically includes the date it was created on. For example, in Windows 11, if a file is named “020322-18890-01.dmp,” “02” indicates the month, “03” indicates the date, and “22” indicates the year the file was created. “-01” at the end indicates it was the first dump file created that day.
The same is true for a minidump file created in Windows 10, which is automatically named something like “mini020322-01.dmp.”
Now let’s move on to opening and analyzing a dump file.
How to Read and Analyze DMP Files
As we mentioned, Windows does not allow you to open dump files directly. However, you can use other tools available online to open and analyze them. One of the most common tools to do so is through the Windows Debugging (WinDbg) tool, which can be downloaded through Microsoft Store. Continue reading the given guide below to use this tool to open and analyze memory dump files in Windows.
Using WinDbg
We have divided this section into 2 parts: Downloading and installing the WinDbg tool and then using it to analyze a dump file.
Download and Install WinDbg
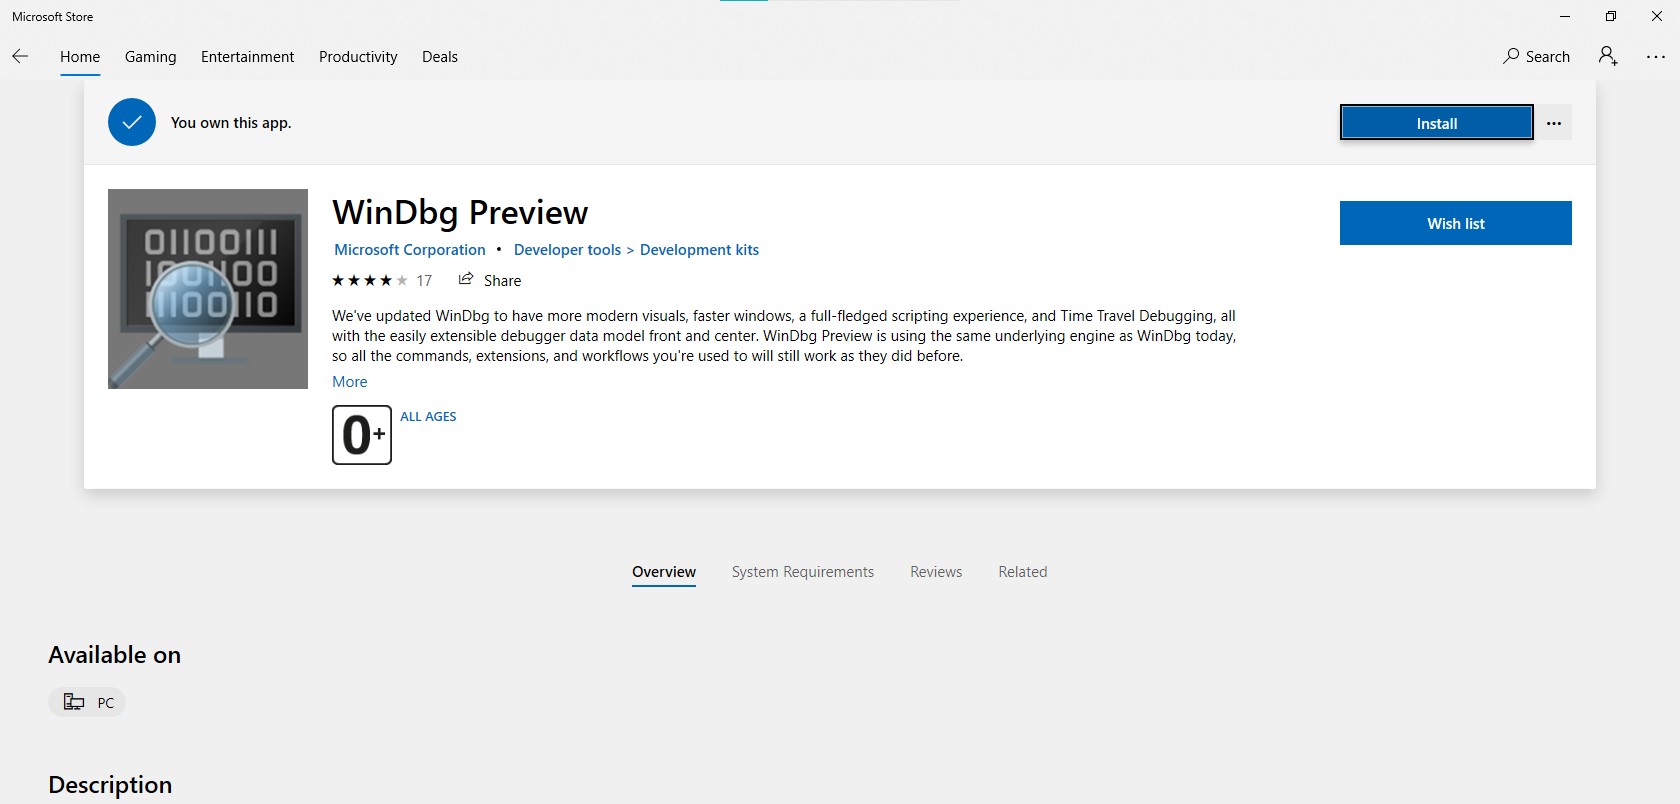
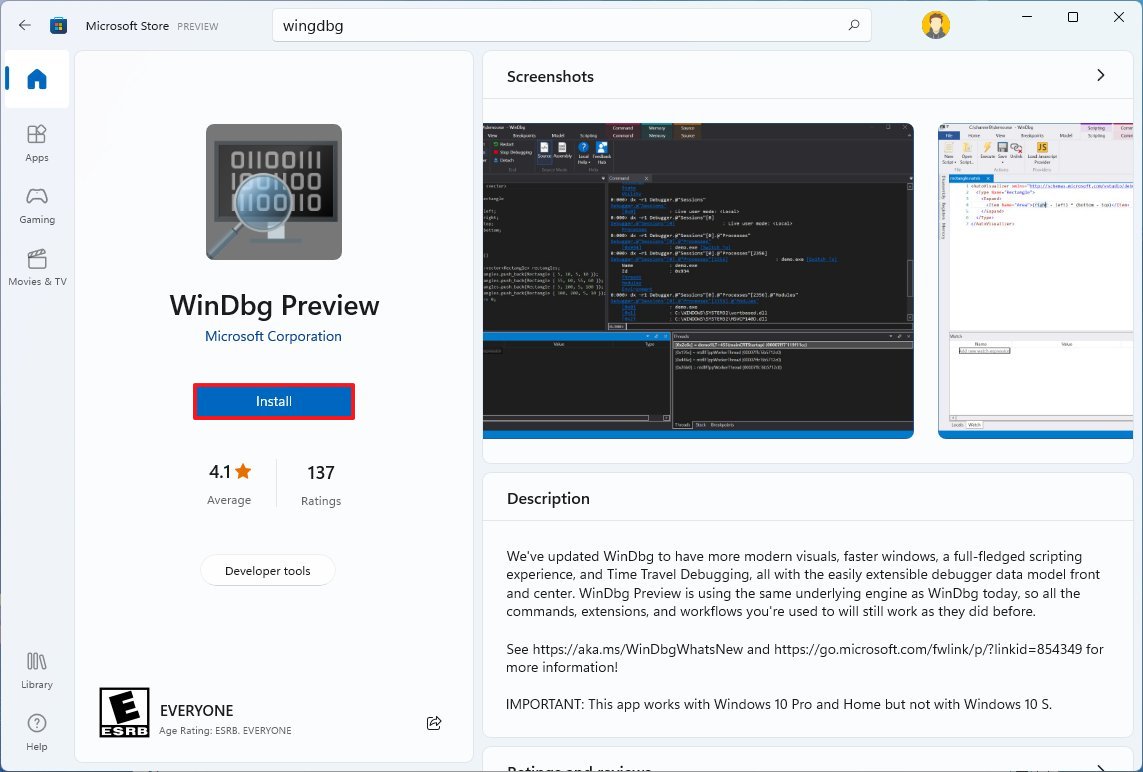
- Open the WinDbg Preview page in the Microsoft Store and click Get.

- The browser will prompted you to open the Microsoft Store app, click Open Microsoft Store.

- From the Store app, click Get again.

The WinDbg tool will now begin to download and then install. We are now done with the installation phase. Let us now use the tool to open and analyze dump files.
Open and Analyze dmp files using WinDbg
- Open the WinDbg tool with administrative rights by searching for it through the search box, right-clicking it, and then clicking Run as administrator from the context menu.

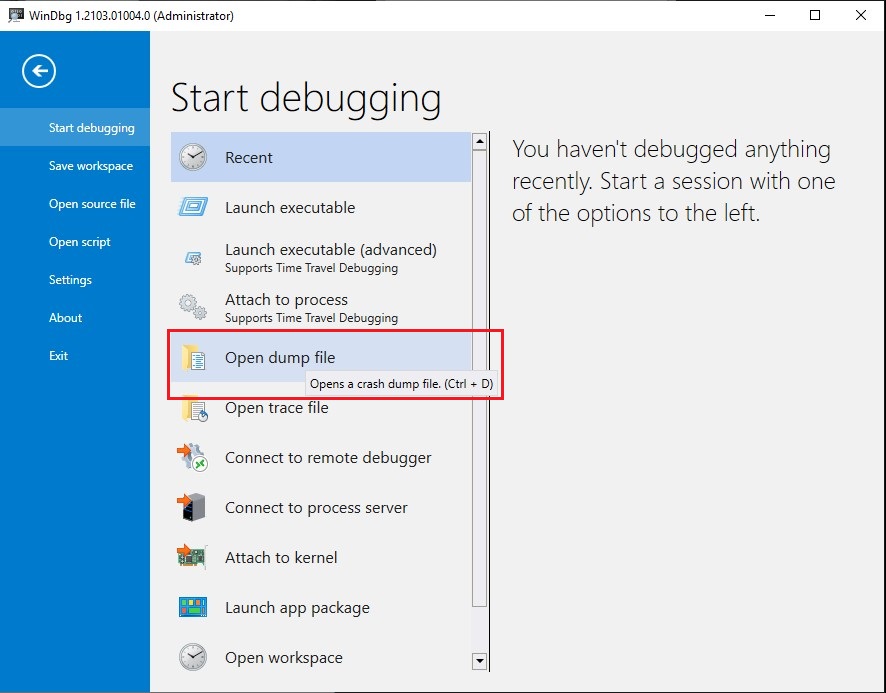
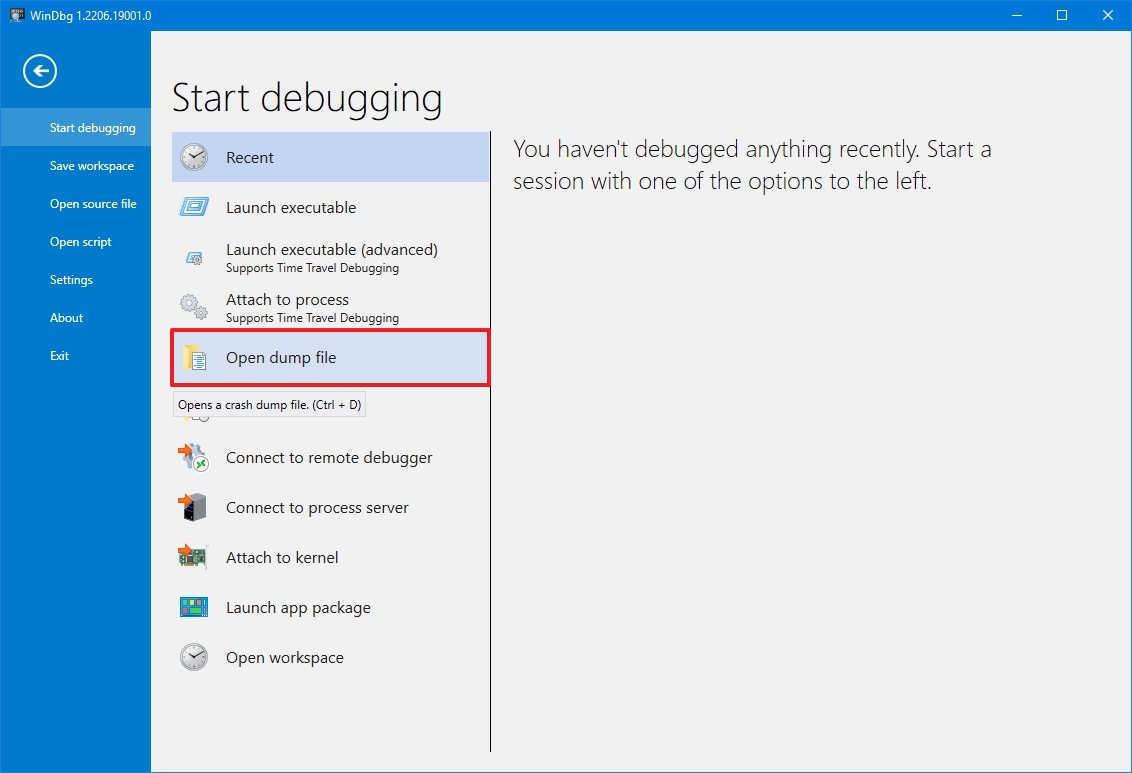
- From the WinDbg tool, click File from the top menu.
- In the Start Debugging tab, click Open dump file.

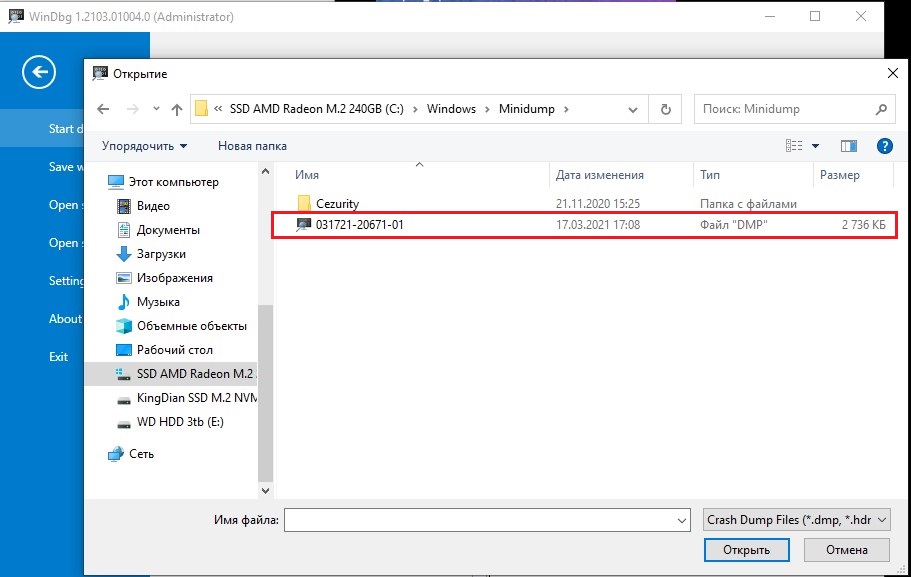
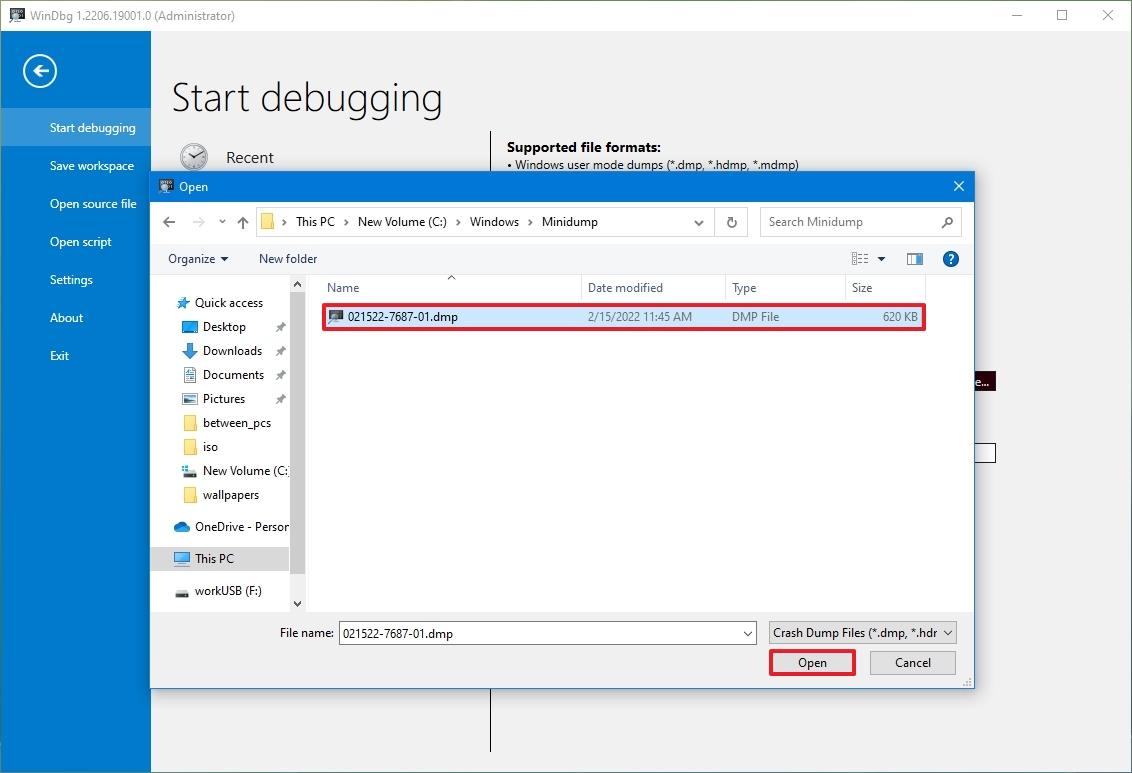
- Now click Browse from the right pane within the tool and select the dump file that you want to analyze by navigating to
C:WindowsMinidump. When selected, click Open.
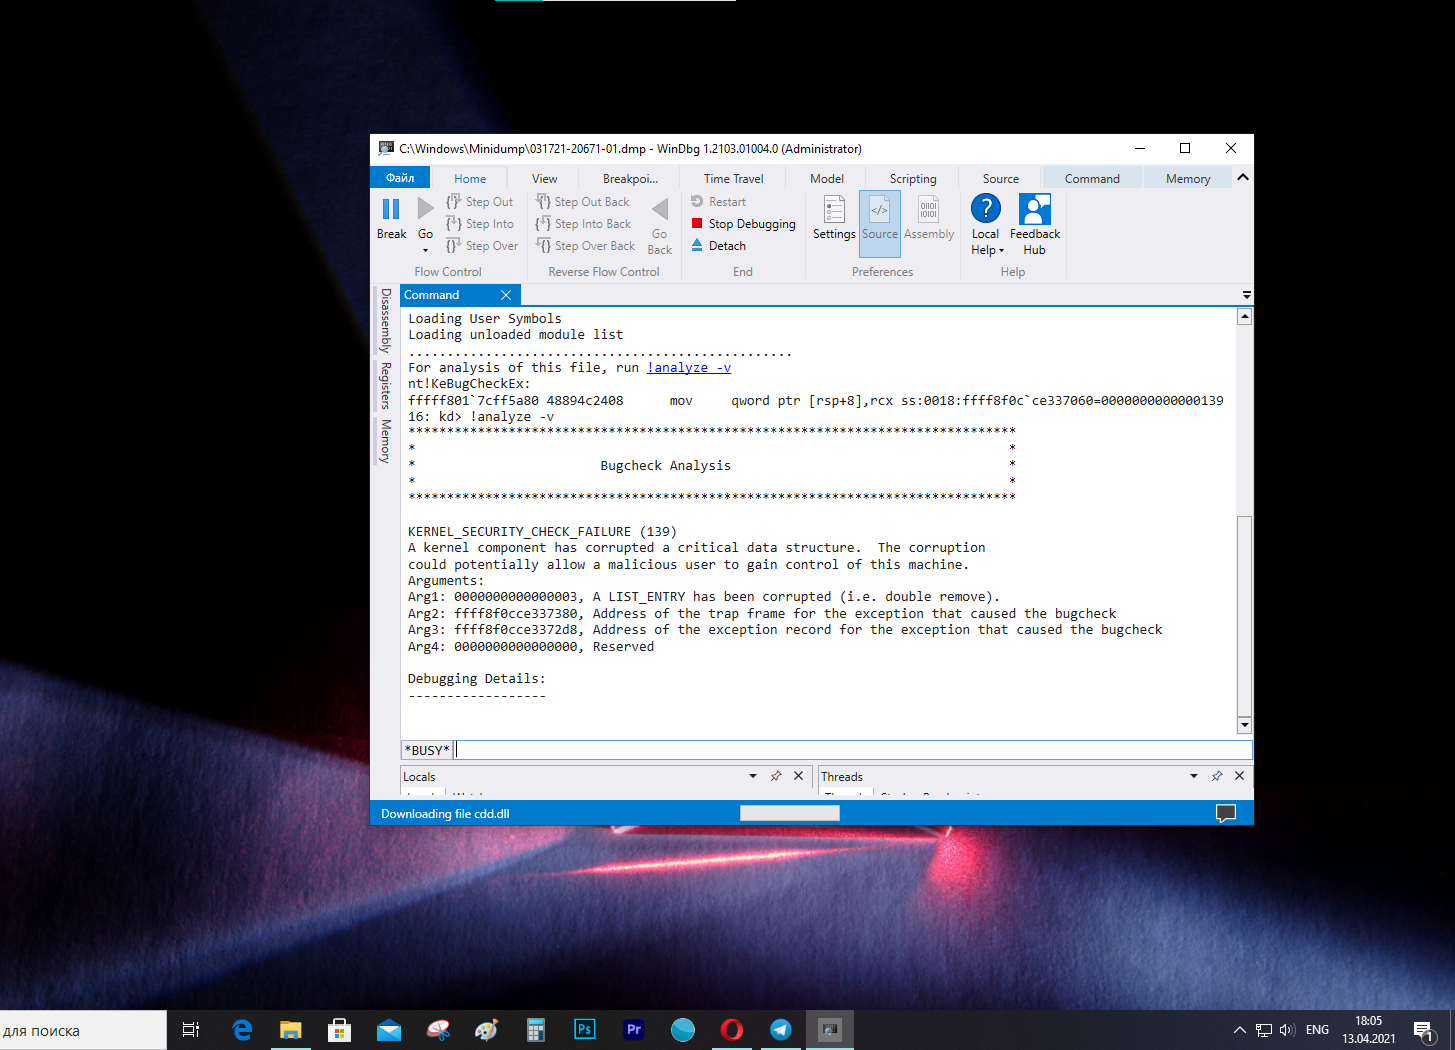
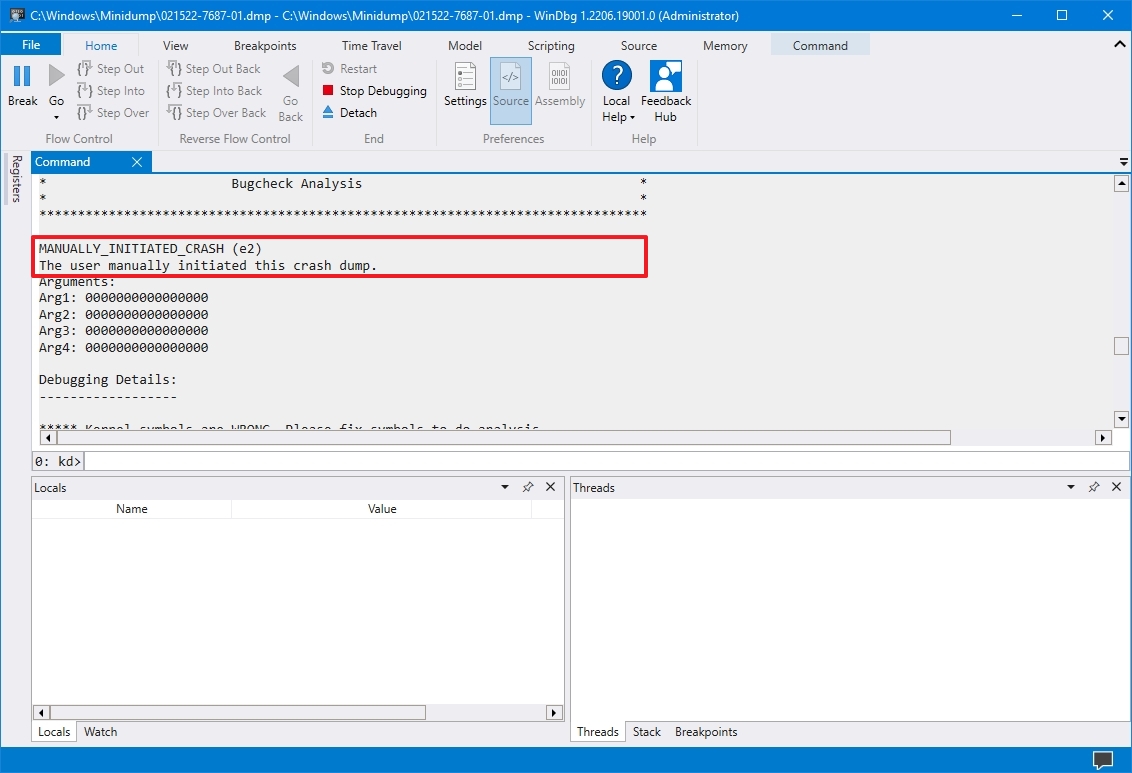
- The tool will now open the dump file, which can take a few minutes. When the dump file successfully opens, type in the following command in the text field in front of “0: kd>“:
!analyze -v
- WinDbg will now begin analyzing the dump file. This can take a few minutes to complete. Once completed, you should see the results in the top window.

In the example above, since we initiated a BSoD intentionally, it states “The user manually initiated this crash dump.” Otherwise, if it were an actual error, you would see different statements and information after performing the analysis of the dump file.
You can then use this information to troubleshoot the error that caused the crash.
Using WhoCrashed
Download WhoCrashed

WhoCrashed is available in both free and paid editions. However, the free edition is sufficient to open and analyze dump files. With this tool, you can obtain reports on the dump files with a single click. The tool will automatically scan your system files for any .dmp files and fetch the data within.
To do so, download WhoCrashed from the link given above, and run the .exe file to install in a few easy steps. Once installed, click Analyze from the ribbon menu at the top. The tool will then take a few seconds to scan any dump files and present the analysis. You can also view the .dmp files discovered from the Dump files tab.
Using BlueScreenView
Download BlueScreenView

BlueScreenView is a portable and small tool that can provide you with relevant information on minidump files. When you run this tool, it automatically picks up any .dmp files in the Minidump directory and displays the relevant information gathered from them. If there are multiple .dmp files, you can click on the one you want to analyze from the top field within the tool, and the information is presented in the bottom one.
Simply download the app from the link given above, extract the content and run the BlueScreenView application.
Final Thoughts
Dump files, regardless of their type, can be pretty useful when it comes to troubleshooting your operating system. However, the methods we have used above to analyze them may not be everyone’s cup of tea, as some of you may find them complex.
That said, there are more methods to analyze dump files using tools, but they involve using the Command prompt, not a Graphical User Interface (GUI). If you’d still like to learn more about it, you can read this detailed post by Microsoft on memory dump files.
 В Windows 10 каждый раз, когда происходит сбой, система создает файл «дампа», содержащий информацию о памяти на момент ошибки. Это может помочь определить причину проблемы.
Файл .dmp включает в себя сообщение об ошибке, список драйверов, загруженных в момент возникновения проблемы, а также информацию о ядре, процессоре и процессах, а также другую информацию в зависимости от типа используемого файла дампа.
Хотя Windows 10 создает файлы дампа автоматически, в системе нет никаких встроенных утилит для их открытия. Тут пригодится инструмент Microsoft WinDbg (Windows Debugging). Он предназначен для отладки кода в режиме ядра и пользовательском режиме, изучения реестров процессоров и анализа аварийных дампов.
В этой инструкции мы расскажем, как открыть файла дампа и попытаться выяснить, что вызвало сбой.
Как открыть файл дампа с помощью WinDbg
Всего есть несколько способов открыть и просмотреть файл ошибки дампа, но самый простой — использовать инструмент WinDbg, доступный в Microsoft Store.
Установка WinDbg
Чтобы установить инструмент WinDbg на Windows 10, проделайте следующее:
- Откройте браузер.
- Откройте страницу загрузки WinDbg.
- Нажмите Получить.
- Нажмите Открыть.
- Нажмите Установить.
После выполнения этих шагов приложение будет установлено и доступно через меню Пуск.
Анализ файла дампа
Чтобы открыть и проанализировать файл дампа, созданный в результате сбоя в Windows 10, выполните следующие действия:
- Откройте Пуск.
- Найдите WinDbg, щелкните правой кнопкой мыши верхний результат и выберите Запуск от имени администратора.
- Выберите пункт меню Файл.
- Нажмите кнопку Start debugging.
- Выберите Open dump file.
- Выберите файл дампа из расположения папки – например, %SystemRoot%Minidump.
- Нажмите Открыть.
- Подождите, пока файл дампа загрузится. Это может занять некоторое время.
- Введите следующую команду в поле Command и нажмите Enter:
!analyze -v
На заметку: также можно нажать ссылку !analyze-v, если она доступна в основной области после загрузки файла дампа.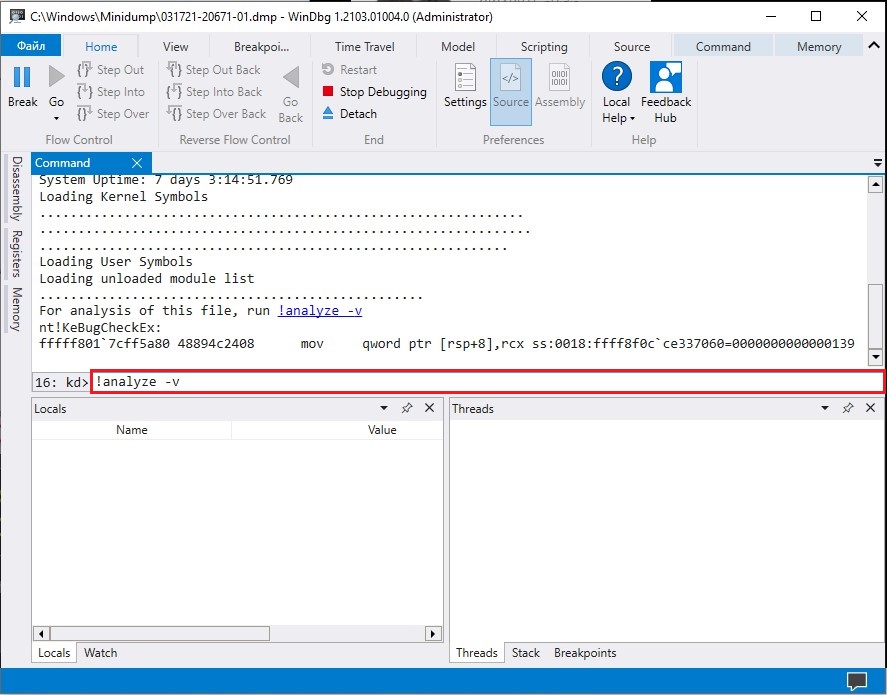
- Подождите завершения анализа — это может занять много времени в зависимости от размера данных.
После выполнения этих шагов приложение выдаст анализ файла дампа, который затем можно просмотреть, чтобы определить причину проблемы и решить ее.
Информация будет отличаться в зависимости от проблемы. Например, этот тестовый файл дампа показывает информацию о синем экране смерти.
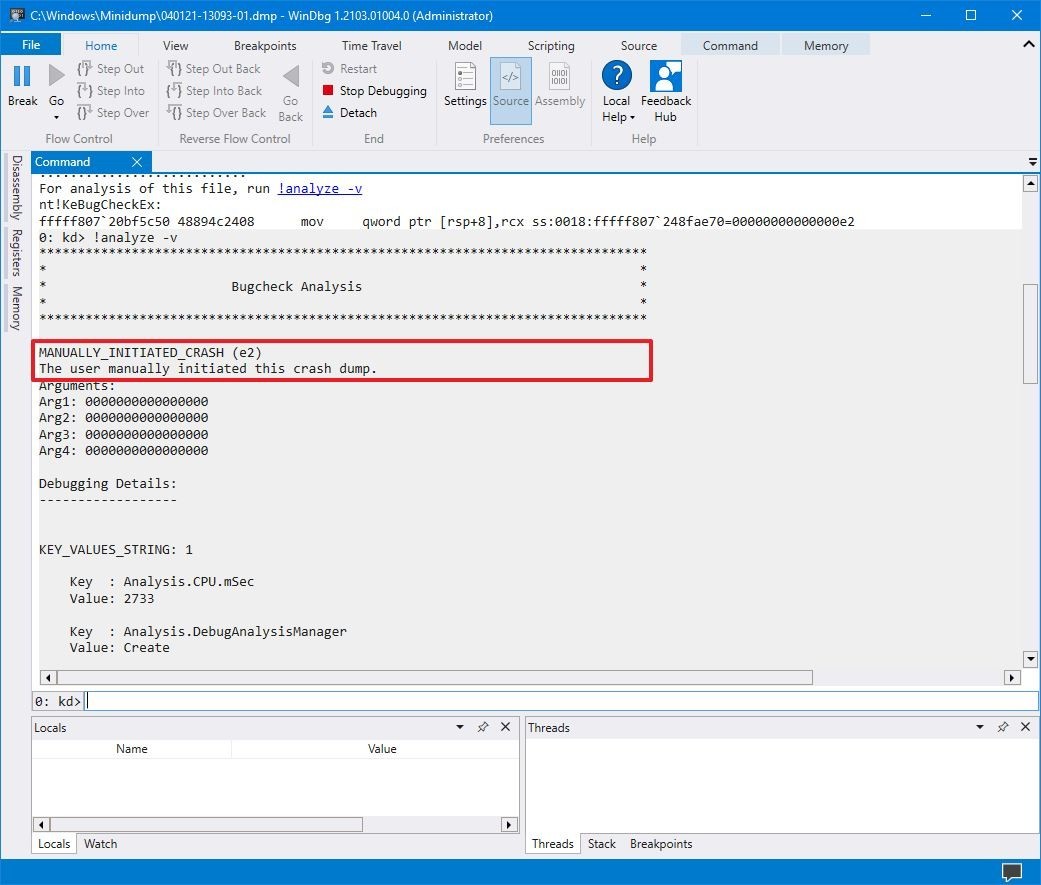
Результат указывает на то, что сбой был инициирован вручную и имеет код ошибки e2 (сбой мы действительно вызвали вручную). WinDbg также довольно понятным языком описывает проблему — из этого отчета понятно, что пользователь вызвал сбой вручную.
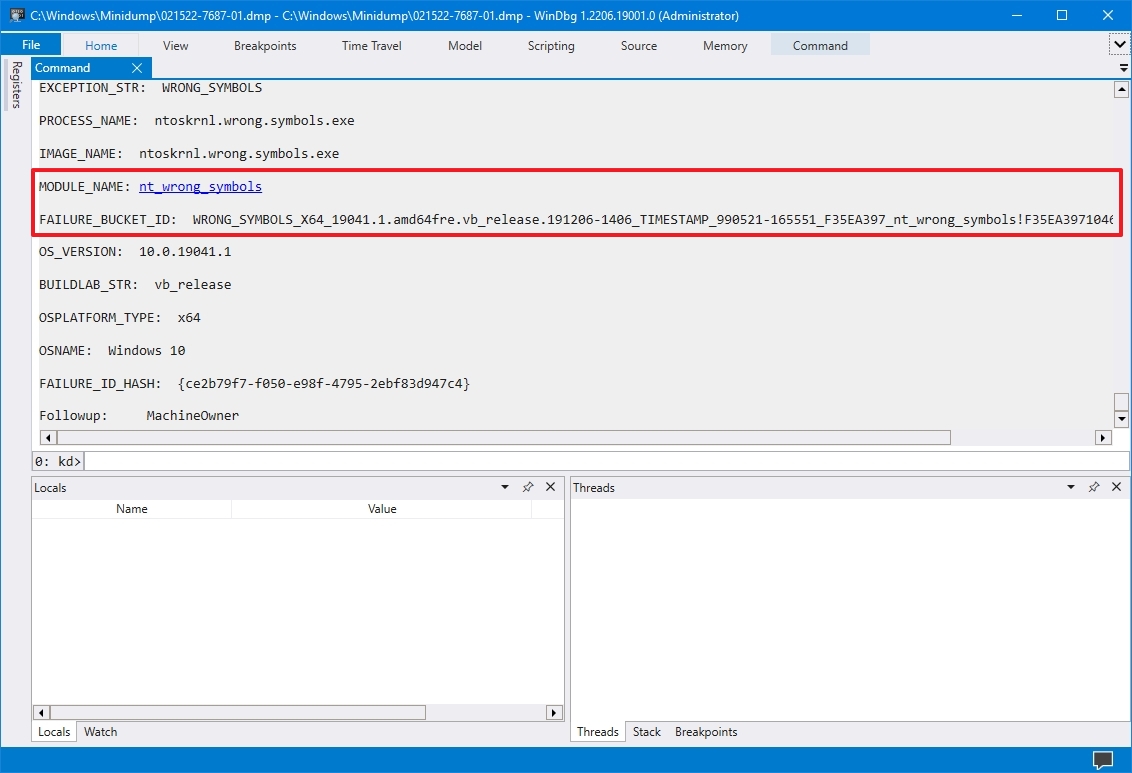
В файле дампа вы найдете и дополнительные сведения, например FAILURE_BUCKET_ID и MODULE_NAME, которые также могут указывать на причину проблемы.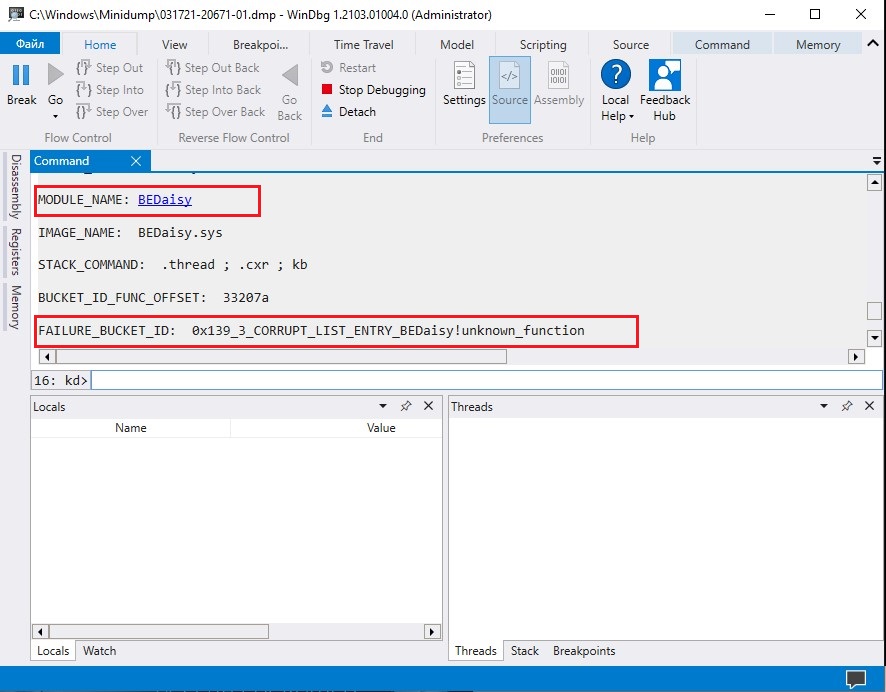
Большая часть информации может привести в замешательство, так как она не предназначена для обычных пользователей. Тем не менее, этот инструмент пригодится, чтобы получить общее представление о проблеме. Если вы не понимаете, в чем дело, данными из отчета можно воспользоваться, чтобы поискать решение в сети.
Новости о программах, устройствах и технологиях Microsoft
Многие знакомы с «синим экраном смерти» или BlueScreen. Синий экран появляется когда в работе Windows возникает критическая ошибка, что приводит к остановке работы операционной системы. При этом операционная система создает дамп памяти, в который записывает отладочную информацию и добавляет запись в журнал событий.
Многие знакомы с «синим экраном смерти» или BlueScreen. Синий экран появляется когда в работе Windows возникает критическая ошибка, что приводит к остановке работы операционной системы. При этом операционная система создает дамп памяти, в который записывает отладочную информацию и добавляет запись в журнал событий.
В Windows существуют два типа дампа памяти — малый дамп (minidump) и полный дамп.
Minidump находится в директории C:WindowsMinidump и его название имеет примерно такой вид Mini051819-01.dmp.
Полный дамп располагается в папке C:Windows и называется MEMORY.DMP.
Просмотр и анализ файла минидампа.
Для просмотра и анализа файла минидампа можно воспользоваться достаточно простой и удобной утилитой BlueScreenView от Nirsoft, которую можно скачать с официального сайта https://www.nirsoft.net/utils/blue_screen_view.html .

Для просмотра минидампа достаточно перетащить файл в окно программы и тут же загрузится отладочная информация. Красным будут подсвечены модули вызвавшие ошибку. В случае представленном на скриншоте выше это был драйвер tcpip.sys.
Щелкнув по имени файла минидампа можно запустить поиск решения в Google.
Но эта программа не способна обработать полный дамп памяти Windows — memory.dmp.
Чтобы посмотреть содержимое полного дампа памяти необходимо открыть файл MEMORY.DMP при помощи утилиты WinDBG, которая входит в пакет Microsoft Windows SDK. Скачать эту утилиту можно с официального сайта Майкрософт по этой ссылке https://developer.microsoft.com/ru-ru/windows/downloads/windows-10-sdk .
Установка и настройка WinDBG.
Запускаем установку пакета Windows Software Development KIT и на этапе выбора компонентов отмечаем «Debugging Tools for Windows».

При первом запуске WinDBG необходимо выполнить настройку сервера отладочных символов.
1. Переходим в меню File > Symbol File Path и вставляем строку:
SRV*C:symbol_cache*http://msdl.microsoft.com/download/symbolsгде C:symbol_cache — это директория куда будут загружаться символы.
2. Сохраняем настройку File > Save Workspace.
Просмотр и анализ файла MEMORY.DMP.
Открываем файл MEMORY.DMP: File > Open Crash Dump. Начинается процесс загрузки отладочных символов, в этот момент внизу будет видна надпись: Debugee not connected.

По окончанию загрузки появится подсказка: «для анализа этого файла запустите !analize-v».

Щелкаем по надписи !analize-v и запускается анализ дампа. В этот момент в строке состояние будет надпись *BUSY*.
По завершении обработки файла дампа памяти Windows нам необходимо найти среди полученной информации модуль, который вызвал сбой в работе. Найти сбойный модуль можно в строках MODULE_NAME и IMAGE_NAME.
IMAGE_NAME:  srv.sys
MODULE_NAME: srv
В моем случае произошел сбой в работе драйвера srv.sys. В строке MODULE_NAME имя представлено в виде ссылке, щелкнув по которому можно получить информацию о модуле.

После выявления драйвера послужившего причиной сбоя в работе Windows и появления «Синего экрана смерти» необходимо попытаться обновить его.
Большинство проблем с драйверами решаются их обновлением.
![]() Download Article
Download Article
![]() Download Article
Download Article
When your PC crashes with a blue screen error, Windows automatically creates a dump file (minidump) which contains helpful troubleshooting information, including the stop codes that led to the error. Opening and analyzing a dump file can help you determine which drivers or programs led to the crash. To read the dump file, you’ll just need to download a simple free crash analysis tool like WinDbg or BlueScreenView. This wikiHow guide will walk you through opening, analyzing, managing, and making sense of Windows crash dump files.
Things You Should Know
- Windows blue screen errors create DMP files in C:WindowsMinidump by default. The location varies if Windows is installed on a different drive.
- You can use WinDbg by Microsoft to open all types of .DMP files—not just those created by Windows memory or kernel errors.
- BlueScreenView is a free debugging tool that clearly highlights the software and drivers that were involved in the system crash.
-

1
-

2
Open WinDbg as an administrator. If you want to analyze system-level dump files, you’ll typically need administrator privileges. To run the app as an administrator:
- Press the Windows key and type windbg.
- Right-click WinDbg Preview and select Run as administrator.
- Click Yes to confirm.
Advertisement
-

3
Click the File menu and select Start debugging. A list of debugging processes will appear.
-

4
Select Open dump file. You’ll see a «Supported file formats» area that displays a list of dump formats and file extensions you can debug with this tool, including:
- Windows user and kernel mode dump formats: DMP, HDMP, MDMP
- Windows binary image formats: EXE, DLL, SYS
- Linux user and kernel mode core dumps and binary formats: ELF, KDUMP
- macOS user mode core dumps and binary formats: MACHO
-

5
Click the Browse button and select a dump file. The location of your dump file will vary. You’ll usually find it in C:Windowsminidump.[2]
- You can also select a compressed CAB or ZIP file that contains a dump file. No need to decompress it first.
- Minidump files are shorter versions of the dump files that are easier to open and analyze. They still contain all of the information you’ll need to track down the error.
- If you’re not sure where your dump files are saved by default, you can check the location in your advanced system settings.
-

6
Click Open. WinDbg will now load the dump file in the analyzer. This might take a few moments depending on the size of the file.
-

7
Type !analyze -v into the command line and press ↵ Enter. This command line is just below the body of the dump file. Running this command will analyze and display verbose information in the Command tab.[3]
- This process might take some time, as dump files can be rather large. You’ll know the analysis is complete when the progress bar is no longer moving.
-

8
Look for errors in the Bugcheck Analysis area. Once the analysis is complete, you can scroll through the data to view information that can help you troubleshoot the crash. Sometimes you’ll see a really clear description of what caused the dump or kernel panic, while other times the text might be kind of vague. It really depends on the type of dump file you’re reading and what caused the issue.
- If you caught a blue screen error in the moment and remember the stop code (such as DRIVER_IRQL_NOT_LESS_OR_EQUAL, DPC_WATCHDOG_VIOLATION, or a hexadecimal code like0xC000000F), search the dump analysis for that string of text.[4]
- You can also look for «MODULE_NAME» and «FAILURE_BUCKET_ID» in the analyzer to find the specific program or driver that caused the crash.
- If you caught a blue screen error in the moment and remember the stop code (such as DRIVER_IRQL_NOT_LESS_OR_EQUAL, DPC_WATCHDOG_VIOLATION, or a hexadecimal code like0xC000000F), search the dump analysis for that string of text.[4]
Advertisement
-

1
Download BlueScreenView by Nirsoft. This free utility makes it easy to open and analyze minidump files created by Windows blue screen crashes.[5]
You can download the tool from https://www.nirsoft.net/utils/blue_screen_view.html.- To install BlueScreenView, click Download BlueScreenView with full install/uninstall support, double-click the downloaded bluescreenview_setup.exe file, and follow the on-screen instructions.
- If you don’t want to install a program, you can download the standalone version by clicking the Download BlueScreenView (in Zip file) link. Then, just unzip the file to find a fully-usable version of the app that doesn’t require installation.
-

2
Open BlueScreenView. If you downloaded the standalone version of BlueScreenView, just double-click BlueScreenView.exe in the extracted folder. If you installed the app, you’ll find BlueScreenView in your Start menu.
- If BlueScreenView detects a dump file (ending with DMP) in the default location of C:WindowsMiniDump, it will display the dump file’s name and date in the upper portion of the window.
-

3
Select a dump file location (if needed). If you don’t see the dump file you’re looking for, you can change the location:
- Press Control + O on the keyboard to open the Advanced Options.
- Click Browse.
- Select the location of your dump file (such as C:MiniDump}} and click OK.[6]
- If you’re not sure where your dump files are saved by default, you can check the location in your advanced system settings.
- Minidump files are shorter versions of the dump files that are easier to open and analyze. They still contain all of the information you’ll need to track down the error.
-

4
Select the dump file you want to analyze. The most recent dump file in the selected folder appears in the upper portion of the window. When you click the dump file, its details expand in the bottom panel.
-

5
Read the dump file. You’ll see the stop code for the dump (e.g., DRIVER_IRQL_NOT_LESS_OR_EQUAL} in the «Bug Check String» column in the top panel. In the bottom panel, you’ll see the drivers and programs responsible for the crash highlighted in red.
Advertisement
-

1
Press the Windows key on your keyboard. If you need to view or change the location of your Windows system dump files, you can do so in your Advanced System Settings. Start by pressing the Windows key on your keyboard or clicking the magnifying glass on the taskbar.
- By default, your system dump files are automatically overwritten with each new crash. You can disable this automatic overwriting if you want to keep old dump files for analysis.
-

2
Type view advanced system settings. A list of search results will appear.
-

3
Click View advanced system settings. It’s a computer monitor with a checkmark icon at the top of the Start menu. Doing so opens the Advanced System Settings window.
-

4
Click the Advanced tab. You’ll see this at the top of the window.
-

5
Click the Settings button. It’s below the «Startup and Recovery» heading near the bottom of the page.
-

6
Select Small memory dump from the «Write debugging information» menu. Each item in this menu is a different type of Windows dump file that you can configure separately. For the dump file generated by a blue screen error, choose Small memory dump from the menu.
EXPERT TIP
Luigi Oppido is the Owner and Operator of Pleasure Point Computers in Santa Cruz, California. Luigi has over 25 years of experience in general computer repair, data recovery, virus removal, and upgrades. He is also the host of the Computer Man Show! broadcasted on KSQD covering central California for over two years.

A memory dump file is a file that’s taken from RAM. RAM has a number of allocation tables—or buckets—inside. A memory dump file is an entire download of whatever was inside that file when a catastrophic failure happened, and it goes into a log so an engineer or a software professional can look at it and see where the conflict happened.
-

7
Find (or change) the location of this dump file. The dump file’s location appears under the «Dump file» heading.
- If you see something like %SystemRoot%Minidump, the &SystemRoot& part of the location is just a link to the root of your Windows installation (e.g., C:Windows). So, if Windows is installed on your C drive and the dump file location is %SystemRoot%Minidump, your dump files are saved to C:Minidump.
-

8
Choose what to do with old dump files when new crashes occur. For small memory dump files, older dumps are not overwritten. However, larger dump files (kernel memory dump, complete memory dump, automatic memory dump, and active memory dump) are automatically overwritten each time a new crash is logged. If you’d rather keep these old logs for analysis, select the log type, then remove the checkmark from «Overwrite any existing file.»
- The complete memory dump file is the largest type of Windows dump file.[7]
If you’re low on disk space and face a lot of crashes, you might want to overwrite these automatically to conserve space.
- The complete memory dump file is the largest type of Windows dump file.[7]
-

9
Click OK to save your changes. If you changed any of your dump file settings, this saves them permanently. You can then click OK again to exit Advanced System Settings.
Advertisement
Add New Question
-
Question
What is a JSON file, and how do I view it?

A JSON file contains JavaScript Object Notation. You can view the file in any text editor.
-
Question
Am I supposed to install visual studies also when I want to read dump files?

No, visual studio is another type of software that won’t help you in that case. It is used for programming.
-
Question
What do I do if I get errors when reading dump file?

Edit the files and go to properties, security and add Everyone as Read. You can then see the file.
See more answers
Ask a Question
200 characters left
Include your email address to get a message when this question is answered.
Submit
Advertisement
Video
-
BlueScreenView is perfect for testing different programs (e.g., opening a program and waiting to see if your computer crashes), as it can be opened quickly and takes only a few seconds to install.
Advertisement
-
Computer crashes—especially ones of the blue screen of death variety—can be caused by anything from a malfunctioning app to a broken processor. As such, being able to read the dump files doesn’t necessarily guarantee that you’ll be able to diagnose why your computer crashed.
Advertisement
About This Article
Article SummaryX
1. Type «advanced system settings» into the Windows search bar.
2. Click View advanced system settings.
3. Click Advanced.
4. Click Settings under «Startup and Recovery».
5. Select «Small memory dump» from the drop-down.
6. Click OK twice.
7. Install BlueScreenView.
8. Open BlueScreenView to find the dump.
Did this summary help you?
Thanks to all authors for creating a page that has been read 1,040,908 times.
Is this article up to date?
On Windows 10, when there is a crash, the system creates a «dump» file containing the memory information at the time of the error, which can help determine the reason for the problem.
The «.dmp» file includes the stop error message, a list of the drivers loaded at the time of the problem, kernel, processor, and process details, as well as other information depending on the type of dump file you have.
Although Windows 10 automatically creates dump files, the only problem is that you won’t find any built-in tools to open this type of file, and this is when the Microsoft Windows Debugging (WinDbg) tool can help. WinDbg is an advanced tool designed for debugging kernel-mode and user-mode code, reviewing processor registries, and analyzing crash dumps.
This guide will walk you through the steps to open a dump file to determine what caused the crash to resolve the problem on your computer.
How to open dump file with WinDbg on Windows 10
On Windows 10, you may find multiple ways to open and review a dump error file, but the easiest way is to use the WinDbg tool available through the Microsoft Store.
Install WinDbg
To install the WinDbg tool on Windows 10, use these steps:
- Open the WinDbg download page.
- Click the Install button.
- Click the Open button.
- Click the Install button.
Once you complete the steps, the application will install, and it will be available through the Start menu.
Analyze dump file
To open and analyze a dump file created by a crash on Windows 10, use these steps:
- Open Start.
- Search for WinDbg, right-click the top result, and select the Run as administrator option.
- Click the File menu.
- Click on Start debugging.
- Select the Open sump file option.
- Select the dump file from the folder location — for example, %SystemRoot%Minidump.
- Click the Open button.
- Click the Open button again.
- Check the progress bar until it loads the dump file (this may take a while).
- Type the following command in the run command and press Enter: !analyze -v
- Quick tip: You can also click the !analyze -v link if available from the main area if available after loading the dump file.
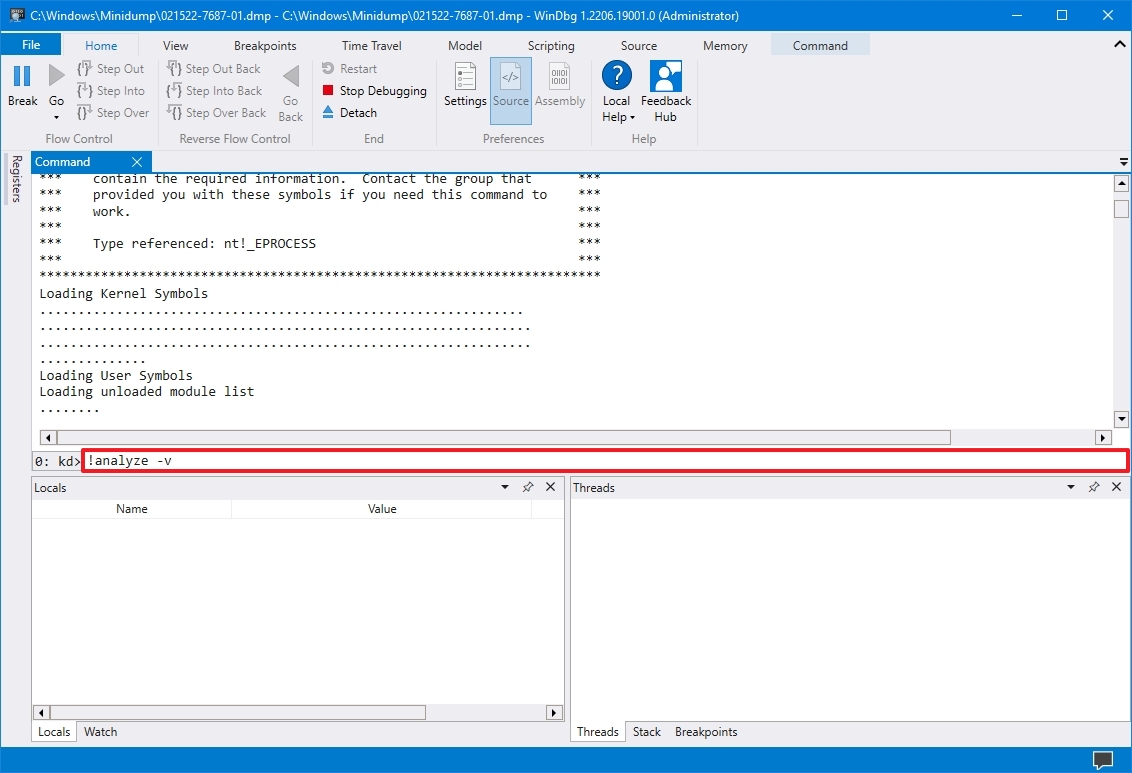
- Check the progress bar until the analysis is complete (this may take a long time depending on the data size).
After you complete the steps, the application will return the dump file analyses, which you can then review to determine the reason for the problem to help you resolve the issue.
The information will be different depending on the problem. For example, this result points out that this was a manually initiated crash with an «e2» error code, which is correct since, for this guide, we use these instructions to force a dump file. The WinDbg even makes an excellent job describing the crash in a language anyone can understand («The user manually initiated this crash dump»).
As you continue reviewing the dump file, you will also find more information, such as «FAILURE_BUCKET_ID» and «MODULE_NAME,» which could indicate what is causing the problem.
The information can be overwhelming since it is not meant for regular users. If your computer keeps crashing, you can use this tool to get an idea of the problem. If you cannot figure it out, you can use the hints in the report to search online for more information.
More resources
For more helpful articles, coverage, and answers to common questions about Windows 10 and Windows 11, visit the following resources:
- Windows 11 on Windows Central — All you need to know
- Windows 10 on Windows Central — All you need to know
All the latest news, reviews, and guides for Windows and Xbox diehards.
Mauro Huculak is technical writer for WindowsCentral.com. His primary focus is to write comprehensive how-tos to help users get the most out of Windows 10 and its many related technologies. He has an IT background with professional certifications from Microsoft, Cisco, and CompTIA, and he’s a recognized member of the Microsoft MVP community.